March the 10th is Mario Day (Mar10)!. Last year @armoursingh put up a fun viz for this using animations (Amar Singh – Happy Mario Day), and this year he challenged me to do something, so I gave it a go!
I wanted to create some kind of game to play for it, and after a little bit of thought I can up with a ‘Slide Puzzle’ like the plastic types I used to have as a kid.
As luck would have it, when I had completed the viz, the March IronQuest subject came out – and it was Games!! Ideal – so naturally this then got submitted!
Here is what I ended up with (excluding the ‘End Game’ content).
So there are a few bits to this part. I’ll break it down to three elements The Parameters, The Animation and Figma Design.
THE PARAMETERS
So initially I just wanted to make sure I could get the concept working, so having a 9×9 grid with 8 marks, and being able to interact with a particular mark to get it to move to the blank space.
I went through a few iterations of this, and I can’t remember a lot of it! So I will talk you through the setup of my final version.
I set up a very basic data source to work with that looked like this:

Very simple – as pretty much all of the work is done in Tableau. Next I have a few parameters to create:
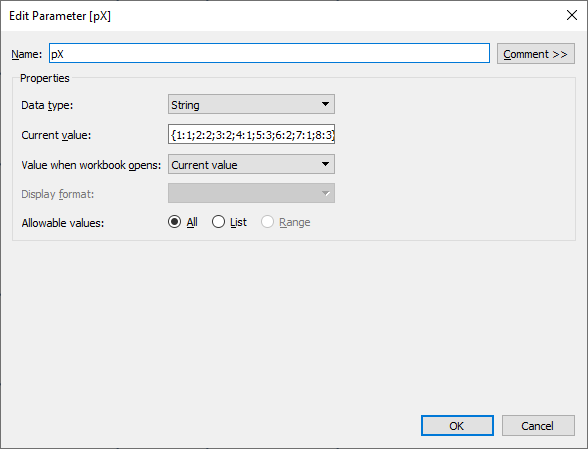
pX
This parameter holds all the X coordinates for each of my IDs from the data set. It holds them in the form “ID:X coord” separated by a “;” and all wrapped in a “{“. NOTE this “{” actually isn’t needed for this to work, I just only realised that when writing the blog and it would have taken me a little too long to change it all!!
This is in a format that I can easily reference a particular X value via the ID field and update when necessary:
pY
This parameter is essentially the same as pX but instead holds the Y values. I could probably have done this all in one parameter but I wanted to keep it separate to make it easier to work out what I was doing!

pBlank
I also need a parameter telling me where the blank space in the 9×9 grid is, so I know which ‘piece’ should be moving on a click, and where it moves to. This is simply the coordinates of the Blank space “x:y“:

Next I need to create a couple of calculations for my X coordinate and Y coordinates based off the above parameters:
X

This case statement looks for the ID value in the pX parameter using FIND by searching for “ID + :”, and takes the associated coordinate from the parameter using the MID function. I then convert it to an integer as it will return as a string otherwise. I then wrap the whole statement in a FLOAT so I have more control over how I fix my axis.
Y
This is the same as X but using the Y equivalent parameter:

Now we can build the initial view as below:

Great! That is the basic grid set up – now I need to add the interactivity to move these blocks around! I need a few more calculations to get this working:
pNewXForParameter

Right – this is a bit of a tricky one. In words this is what we are doing:
- (ABS([X] – INT(LEFT([pBlank],1))) = 1) : This checks if the X coordinate is 1 away from the Blank space – this is the only time we would want to move it (e.g. we can’t move from x=1 to x=3 as there is another ‘Piece’ in the way.
- and ([Y] = INT(RIGHT([pBlank],1))) : This checks that the Y coordinates are the same – we would only move along the X axis if the Y axis of the blank didn’t change.
- replace ([pX],str(ID)+”:”+str([X]),str(ID)+”:”+LEFT([pBlank],1)) : This if the above conditions hold, we will replace the current X value in the pX parameter with the updated one (which is what the blank parameter X value currently is).
- else [pX] : otherwise keep the original parameter as we don’t want to change it.
This calculation is made for all IDs, but will will only pass it to the parameter action on the selection of one parameter.
pNewYForParameter
This is the same as above but with X and Y switched:

NewBlank
We also need a field to update our pBlank parameter:

This uses a similar approach to the X and Y updates, but combines then. We know we will only be changing an X value or a Y value, so we can use and if statement to check X’s first, then Y’s else just leave as is (clicked a Piece that can’t move)
We can add all of these to the ‘Detail’ shelf in the worksheet, and then add three parameter actions to update the relevant parameters on select by the user. See the X update parameter example here:

With the three actions in place, we get the following which is what I wanted to see:

So this is the fundamentals of how the parameters are working in the workbook, now it just needs to start to look like something! Moving on to…
THE ANIMATION
For the animation side of things I will use the trick I have used a number of times in the past, which I blogged a while ago here: Animated Hex Maps
Basically I will be using a transparent overlay of the same worksheet to act as the interactive element, meaning I can keep a ‘clean’ version of the visual worksheet that will animate fine. This is because animations only work if your discrete values aren’t dynamic (which all of my above calculations are) – so we need a clean sheet underneath which only has the basic info we need – ID in detail and X and Y continuous for plotting.
The blog above covers this so I won’t go into detail, but the ultimate result is this:

Getting there now – so now for some pictures!
FIGMA DESIGN
Here is where I went into Figma and went image searching. I wanted a suitable background image to use for the puzzle, and found that via Wikipedia – originally from a Nintendo tweet:

I dropped this image into Figma 8 times, and then basically cropped each one to the size of one ‘Piece’. I found that by creating a Frame in figma the same size as the image, and then putting a 9×9 layout grid on top of that frame allowed me to crop the image accurately as Figma will ‘snap’ to the layout grid.
There may well be an easier way to split an image – but this worked well enough for me! I then just rounded off the corners slightly (like a ‘Real’ slide puzzle would look) and exported each tile individually.
Now I can add them to my shapes card in the tableau worksheet and get the images moving as well:
The final part of the slider was quite simple – just some simple rectangles in Figma which were a bit larger than the tiles above which just goes as a background image behind them (making sure all the sheets on top are set as transparent):

And here we have the final ‘Working’ version! This covers the majority of the fundamentals in the dashboard. Now just to tidy up a few things, and add the last few surprises.
FINISHING OFF
Help Screen
I added a help screen overlay which is just a show/hide container with the writing overlay designed in Figma. I also made the show/hide button images in Figma to match some of the red from the picture:

Counter
I added a ‘Counter’ to the view to show the user how many turns they had taken. This uses a ‘pCount’ parameter (an integer starting at 0) and then a ‘CountAdd’ calculation to increment the counter on click:
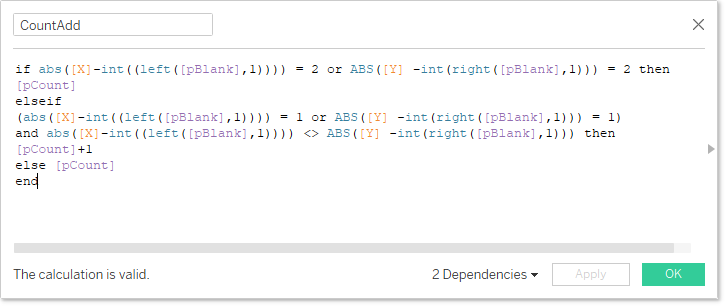
This calculation checks for a few conditions to make sure the tile will move – as we don’t want the counter to increment if the tile is not moving.
I then added a simple worksheet showing the count number, and overlaid this onto another Figma square the same dimensions as the show/hide container button:

Help Icons
I decided that people might not have the time to spend completing through the puzzle, so at certain counter points I added a help option that will ask the user if they want to Auto Complete the puzzle instantly, or carry on. This will show up at 10, 20, 30, 50 turns, and then every 50 turns after that. These images I also made in Figma and put onto a worksheet:

I found a free from attribution picture of the mushroom online, so used that in the image. I also then floated two transparent sheets over the buttons so I could control the parameters to auto complete or not.
For Auto Complete:
In order for this to work, I save the ‘Solution’ for the X, Y and Blank coordinates as separate parameters that look just like the pX etc. parameters:

And when ‘Auto Complete’ is pressed, I can use these to send the solution through to the actual plotted parameter.
I also have a new parameter for showing and hiding the ‘Quick Finish’ help box:

So I can control when this view get shown. Here is a picture of how the quick finish sheet looks:

The ‘CountForMessage’ shape calculation allows me to choose what picture is shown:

The last part of the If statement uses the Tableau Modulo operator (%) to work out if the count is a factor of 50, if it is you can show the default help message.
Complete Image
When the solution was achieved by the user, I wanted to replace the Tiles on view with the full original picture (not broken up) and I did this by inserting another sheet in between the transparent interactive sheet and the tile sheet. This worksheet had the background image set as the full Mario image and would only appear when the solution was achieved (hence hiding the tiles underneath. So when complete we would see this:

Final Mario Animations
Finally for a bit of fun, I wanted to animate in some different images of Mario as a “congratulations” for completing! I did this by finding more attribution free images, and bringing the marks into view once the solution is achieved. I actually used a separate data set to control this to make it a bit clearer while I was building:

But essentially all I did was set the marks to be off the chart when the solution wasn’t achieved (via fixing the axes) and then bringing them in once the solution was achieved.
Once all of these were done, I had my final dashboard!

Final Thoughts
So one thing that tripped me up a lot during this, and something I couldn’t quite work out why, was the animations. What seemed to happen is I would have it all working fine, and then I would tinker a bit and all the animations would stop working (even on Desktop) – so I would have to revert to another version to get them working again. This also often happened when I had a working version, saved it and reopened it later only for it to stop animating again. Haven’t been able to work out why but managed to get a version to Public that did animate!
I really enjoyed getting this working, and hope you were able to follow the blog. I raced through some of the latter bits on the help prompts etc. so if anyone wants me to go into more detail, please let me know.
The workbook is downloadable at the below lonk, so feel free to have a play and see how it works (and see if the animations break!!).
Ant.

This is so beautiful and inspiring! Great Work Ant! I am going to try it out!
LikeLike