Hi All,
Highlighting some more cool visualisations that I have seen over the last couple of months!
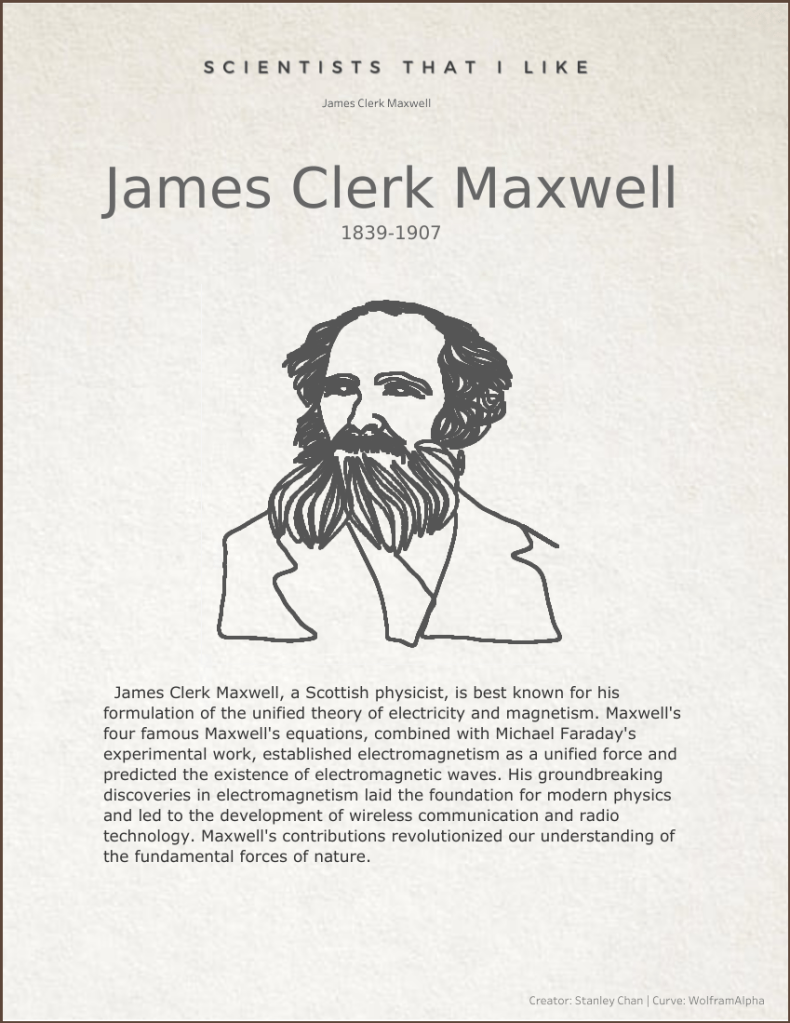
Stanley Kin Nok Chan – “Scientists That I Like”
Stanley rendered his favourite Scientists in lines using parametric equations in Tableau, and it looks really cool! You can switch between them using the drop down menu. The animations don’t display on Tableau public, but he has put a link to where you can see them in action.
https://public.tableau.com/app/profile/stanleykinnok.chan/viz/ScientiststhatIlike50000/notebook
Brittany Rosenau – “Flavor Distribution across 50 Fruit Snack Packs – Overlay Edition”
This won a #VizOfTheDay shout, and for good reason. Brittany cleverly uses native Tableau features (e.g. annotations) to create different types of Overlays for your dashboard – useful if you don’t want to be dipping into other design tools!

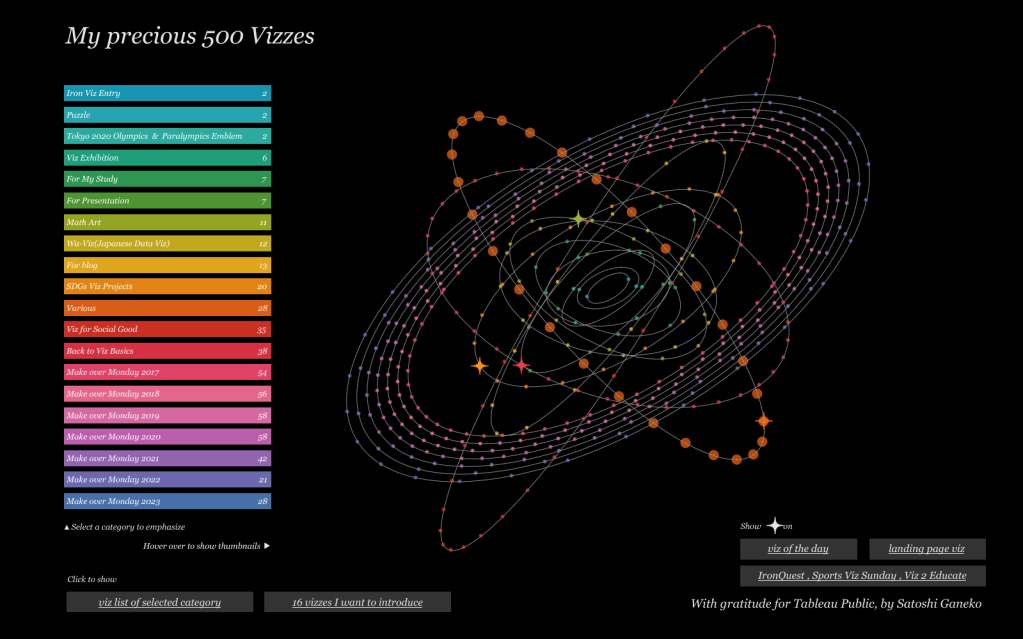
Satoshi Ganeko – “My precious 500 Vizzes”
Big congratulations to Satoshi Ganeko for hitting 500 vizzes on Tableau public – and what a fantastic way to show them with this starry spectacular! Check out the download of his workbook for plenty of trigonometry calculations!
https://public.tableau.com/app/profile/satoshi.ganeko/viz/Myprecious500Vizzes/DB_Main
Zsofia Nika -“New York Philharmonic: Piano Concertos since 1846”
I love music vizzes, and this one is a cracker – lovely simple colour palette and some more trigonometry fun!

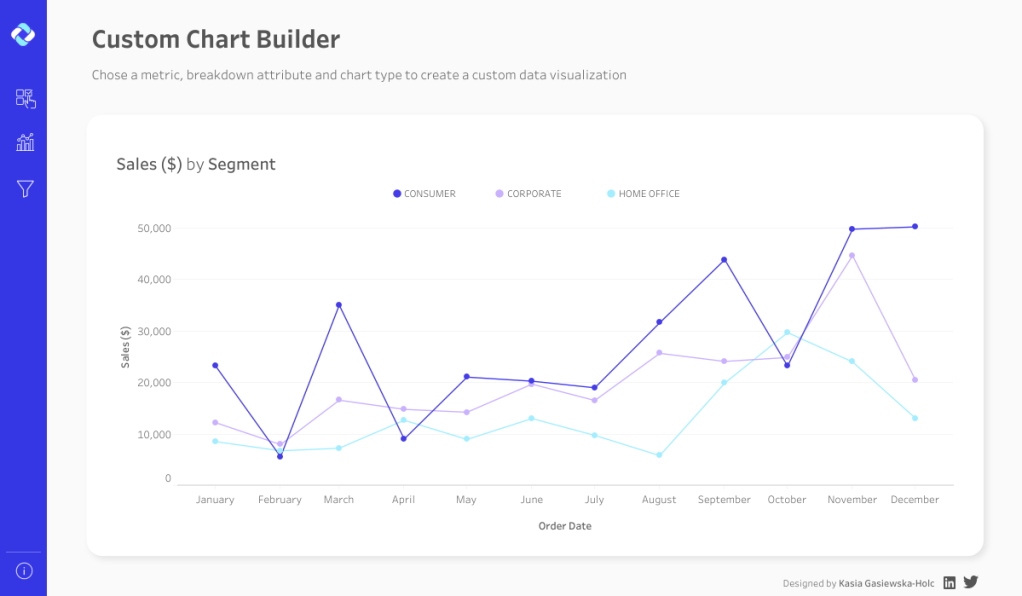
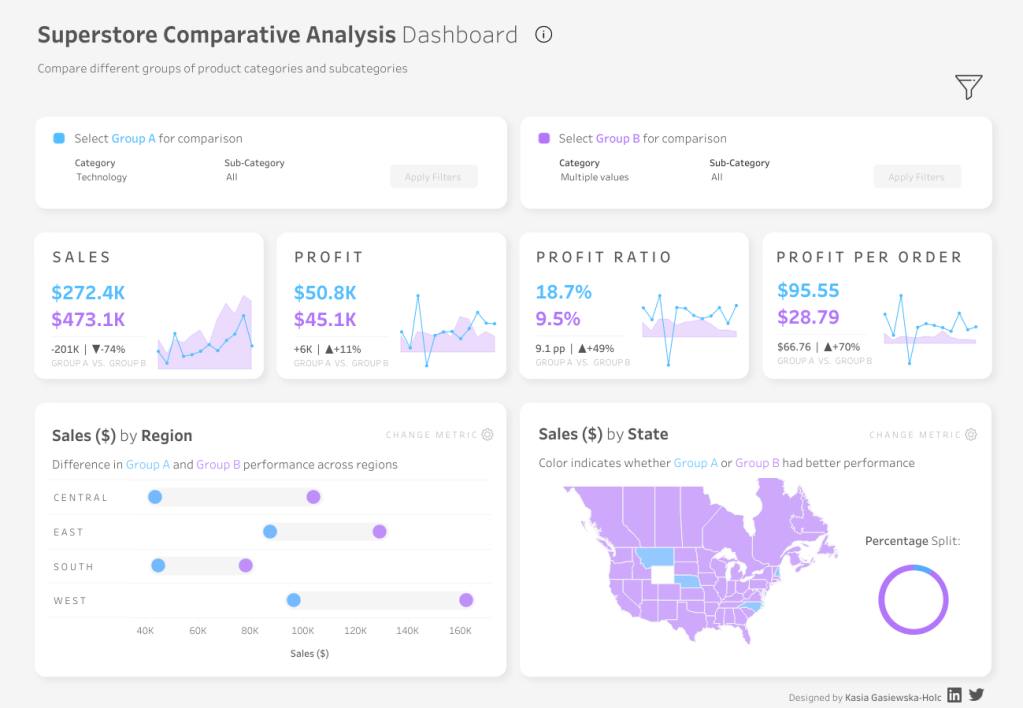
Kasia Gąsiewska-Holc – “Custom Chart Builder” & “Superstore Comparison Tool”
Kasia has produced some great business dashboards recently – the #VizOfTheDay winning Custom Chart builder and the Superstore Comparison Tool. Both showing really relevant uses of Parameters and Dynamic Zone Visibility particularly.
Joris van den Berg – “Data Season: a Mobile Magic Dashboard”
I enjoyed this fun one from Joris – I particularly like the mobile phone styling of it, but also the fun and informative dynamic text that pops up depending on the month chosen!

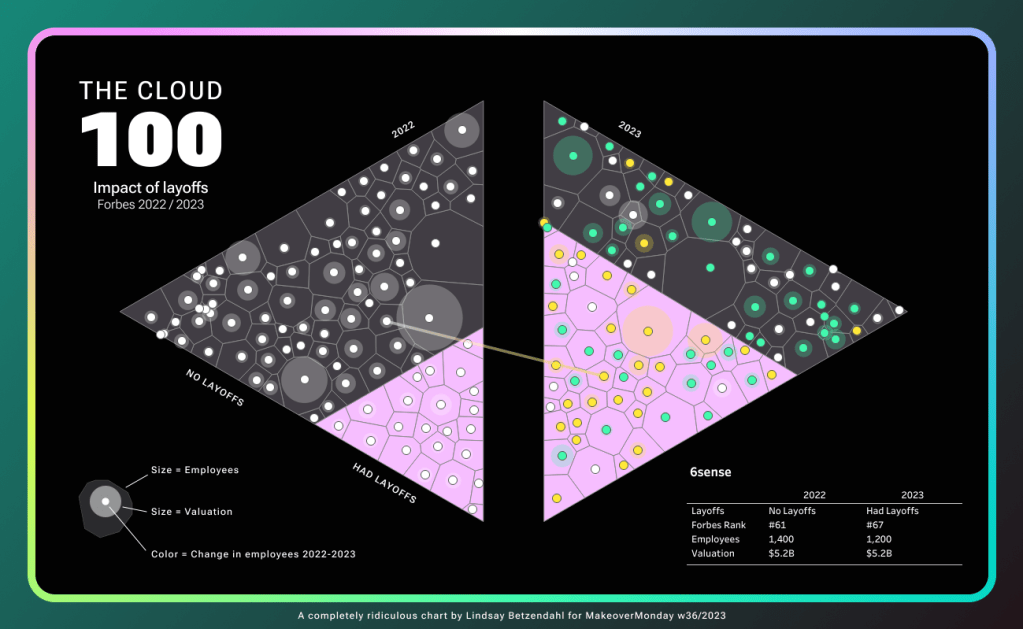
Lyndsay Betzendahl – “Forbes Cloud 100 Impact of Layoffs”
Here is a beautiful one from Lyndsay – and I’m not going to pretend to know how to build it! This is a very aesthetic looking Voronoi and I love the colours as well. More than anything I like the tagline ‘A completely ridiculous chart’!! 😊
Ant.
