Hi All, I recently posted the below viz of an animated Rudolph the Red Nosed Reindeer sing-a-long. It’s pretty simple but I had to overcome a few things around the Pages shelf and how it synced across worksheets, so I thought I would share!
But First – the data
First of all, a quick summary of how I got the data together. Normally when I have vizzed music before, I have got hold of the data behind a midi file to do this. But for this one, as it was so simple, I just created it myself in Excel.
To do this, I first googled some simple sheet music for the tune that looked like this:
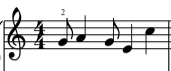
And assigned a number for each ‘Note’ – I kept this simple (and not strictly musically accurate) by just naming the lines and spaces on the stave sequentially:

This way I could use this as my y axis to place the notes. So in the example music above, the first note (a ‘G’) would be a number ‘3’ on my scale. I had originally started from ‘1’ but then realised the music dropped to a D at one point so had to add a 0!
The next thing I had to think about was the length of each note, and how many ‘Pages’ I wanted to have in my visual. For the timing to work well I needed to have each page at the shortest note length throughout the whole tune. Thankfully this tune isn’t too complex, and the shortest note is a half beat (a quaver) – meaning there are 8 of these in each bar (the example music above equates to 1 bar).
From this I built up my data set to look like the below with a few additions:
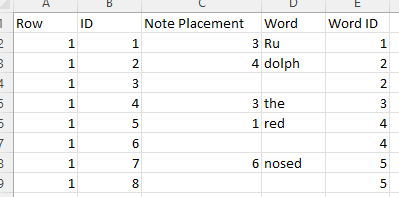
These 8 rows are the data behind the first bar example above. To explain this:
Row. This is the row that I want the Lyric to appear on (i.e. the eight rows you can see in the gif)
ID. This is a unique ID for each half beat of the music (there are 256 in total – hence 256 pages)
Note Placement. This is the number I derived from above to be used for the Y axis of the scatter chart. Note: there are gaps where the note lasts longer than half a beat – this is to avoid showing multiple marks on the viz for just one note.
Word. This is the lyric that is sung for that note.
Word ID. This is the ID of the word on each Row, and is used to control where the red underline for the sing-a-long words is placed. Note: there are no gaps for this one, as I want the red mark to stay visible throughout the length of the note.
The Build
Next to build the vizzes! Firstly I wanted to make sure that my scatter plot would work the way I had envisioned – which was to start of blank, and fill up with the notes as the song progressed. This is how the sheet was set up:

Initially when play was pressed, I was greeted with a bouncing single ball, and not the history I was expecting, even when ‘Show History’ was checked. This was because I also needed to make sure the ‘All’ option was selected in the further menu, and not just ‘Selected’:

Here I also tweaked some of the defaults, turning off the fade and selecting a % opacity format for the historic marks. But this was it for the tune part of the viz.
In terms of the lyrics and the red underscore – I had originally planned for these to be on one sheet. However I quickly realised this wouldn’t work as although I want the underscore to be synced with the tune above, I wanted the lyrics to be visible all the time. So for this to work the lyrics needed to be a separate worksheet which looked like this:
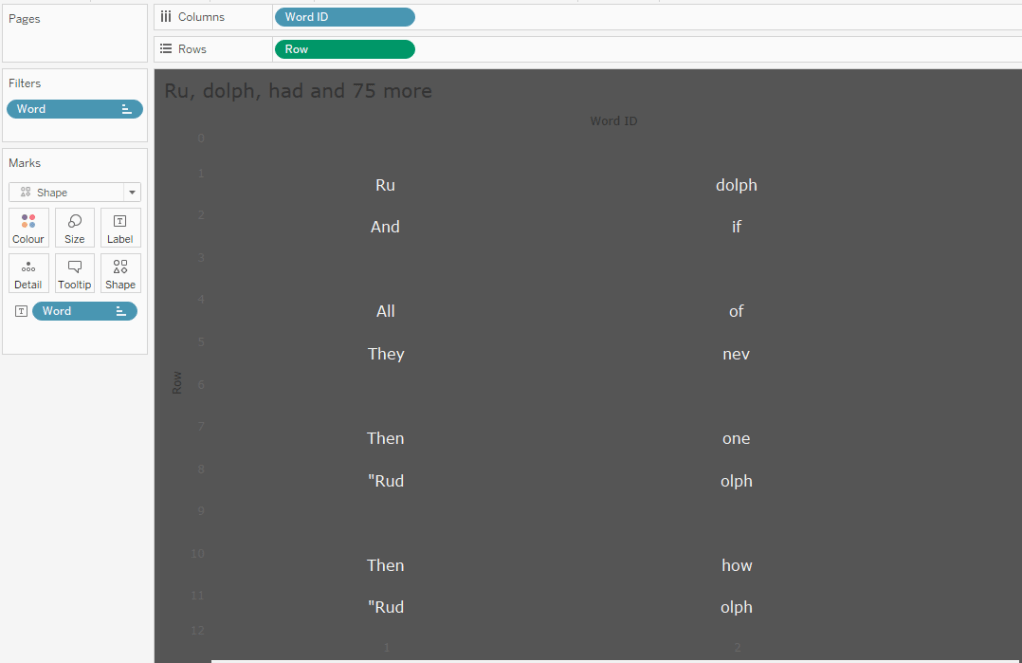
Here you can see it with headers switched on. The Row as per what I entered in the data placing the words on the Y axis, and the word ID spacing the words appropriately left to right. I used a transparent shape mark with the word as a label.
Pretty simple for the lyrics, so onto the red underscore. The viz itself is basically the same as the Lyrics page, just using a custom shape as the underscore. However for page animation, I originally thought I could just set it with no history shown – and this sheet could sit under the lyrics sheet. However, when you sync page animations across multiple pages, they are all bound by the same page control – so if you set history on for one, then you get it for all of them!
A bit of a pain I initially thought, but then I realised there was an easy fix – and that was just to make the historic marks the same colour as the background so that it appears they don’t exist! As thankfully the colours don’t sync accross the worksheets.
Here is the underscore page running just as a worksheet:
You can see the dark grey historic marks clearly, however when running against the same coloured background, it is like they don’t exist!
So that is everything sorted and synced! It was just a case of some careful (and manual) floating and sizing of the two lower sheets so the underscores appear in the right place, and the whole thing was complete!
So all a bit of fun really, but good to pick up some new info about how the page shelf works!
Hope you find this useful.
Ant.
