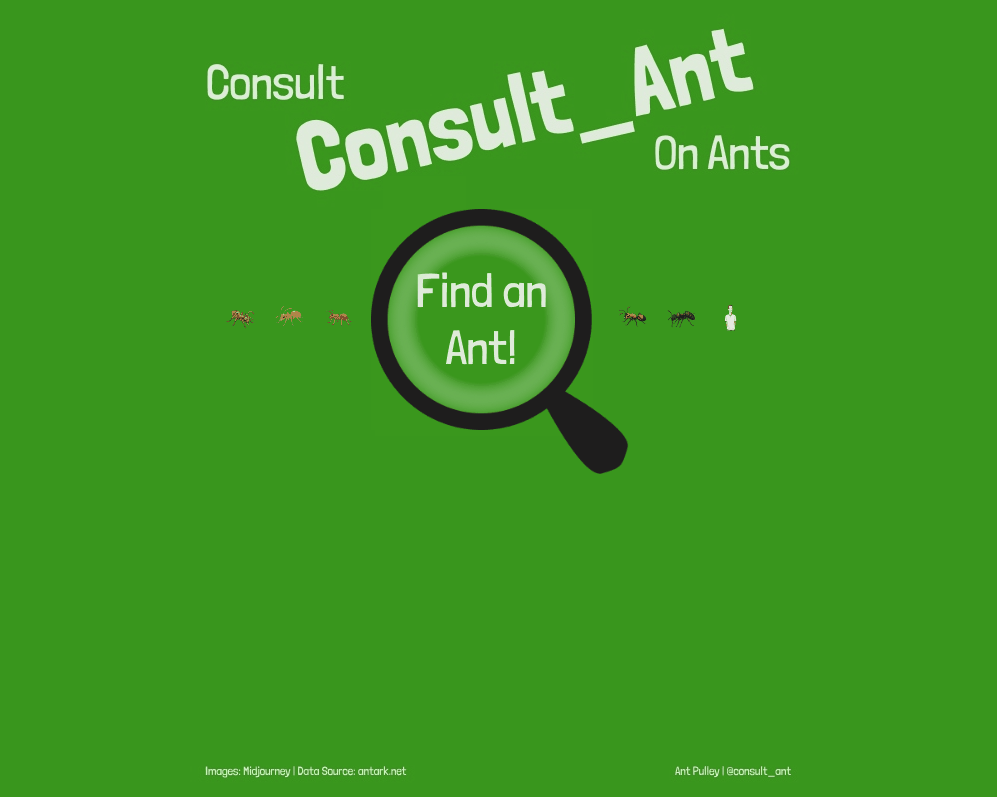
Hi All. This blog post is going to talk about how I built my recent ‘Consult Consult_Ant on Ant’s’ viz, as well as where the idea came from:
The Idea
So the idea has been around for a year or so, and took a while to come to fruition! In my list of random ideas, I had put ‘Consult Consult_Ant on Ants’ down as a one-liner with no real concept of what it was going to look like. Then in June 2023 I spoke at the London TUG and shared a few of my random ideas, at which point CJ Mayes suggested we vote on one for me to do next – and surprise surprise this one came out first!
So I had to make it a priority to try and finish, but I still couldn’t get a solid idea of what to do in my head, so it just stayed in the back of my mind for many months. Then as I have been co-leading the Tableau Public User Group, I have been seeing loads of really creative vizzes and ideas, and I think that kick-started my creative ideas again!
After that, I realized I had something else on my ideas list that I could do at the same time That idea was simply ‘Magnifying Glass’. I believe the original intention behind this was to somehow build a magnifying glass in a viz for zooming in to certain elements. And hence this viz was born!
I loved the idea of getting the feeling of searching for the ants and animating it so that it appeared that the Ants increased in size under the magnifying glass. It didn’t end up how it was initially in my mind – I had thought of scattering the ants around and trying to make a moving magnifying glass, but I decided to keep it simple.
For the lower part of the viz, I was keen to just have some simple information around each of the Ant types; so as well as trying out a fun viz type, I’m also providing some interesting information!
The Data
My data file was very small and looked like this:
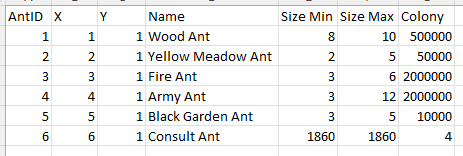
It has an AntID column as an ID for the ant type. X and Y coordinates for positioning of the marks. A ‘Name’ for the ant type. The Min/Max size of the particular ant and the max colony size for the ant. All the ant-based data came from https://antark.net/.
The Viz – Top Half
I’m going to split this build into two, starting with the main event which is the top half. Essentially this is built with a lot of layering in Tableau to get the desired effect. To give you a rough idea to start, here is what the layers were:
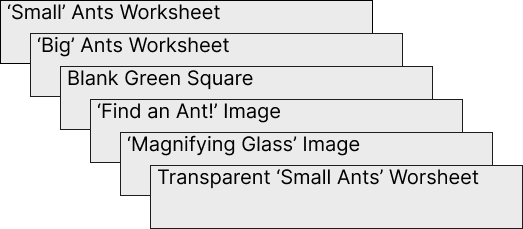
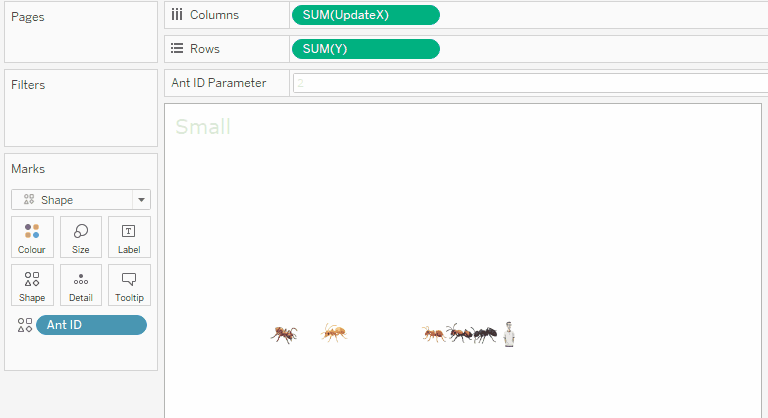
Small Ants
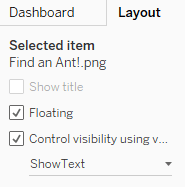
The base sheet contained the Ant Images, and the position of each mark was determined by a parameter and a calculation.
Ant ID Parameter:
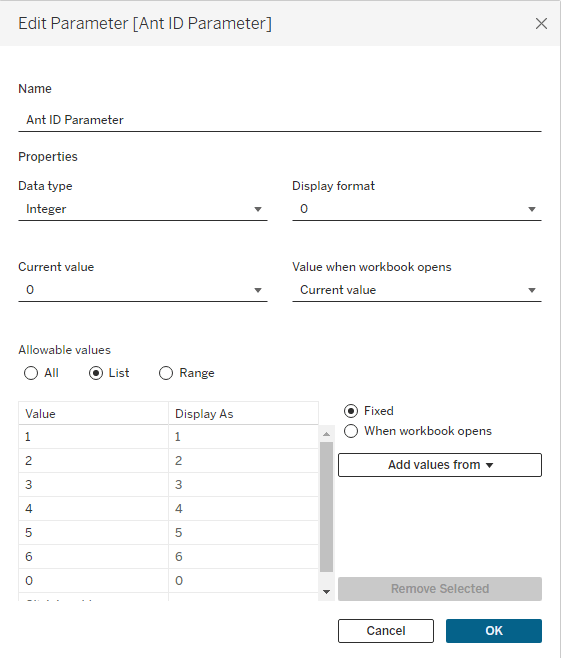
This parameter could be the Ant IDs from 1 to 6 which relate to the data, or 0, which would denote the ‘Starting position’ of the viz – i.e. when the ‘Find an Ant!’ message is displayed.
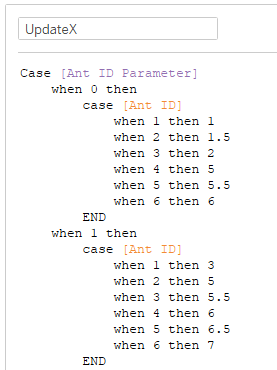
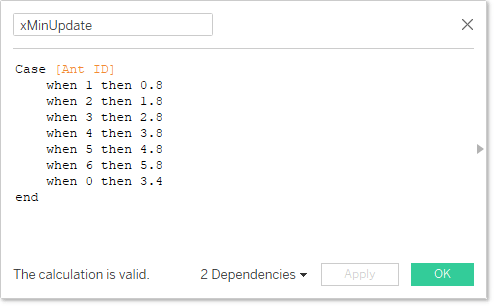
UpdateX
This image shows part of the UpdateX calculation – it is basically a manual job of assigning where I wanted each ant to appear in a row, depending on which ant is selected. And I wanted this to feel like you are ‘Moving’ along the row as you find the ants, so they all gradually move to each side.
So as the parameter changes (which is triggered from the last layer), the ants move along:
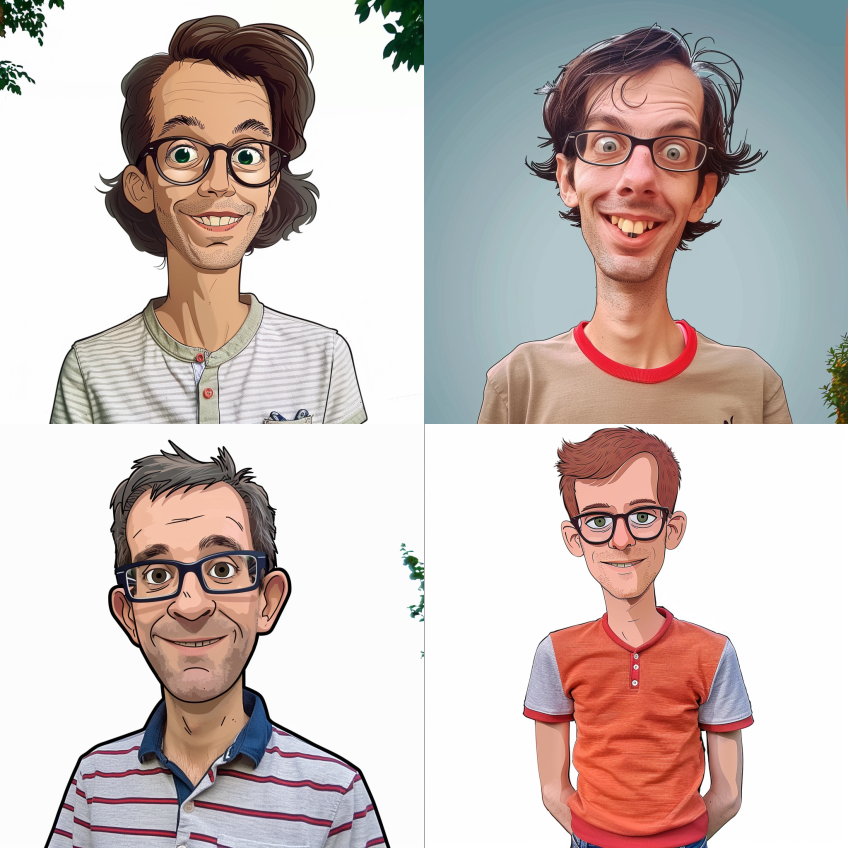
In terms of the images – these were built in Midjourney, an AI Image generator. And I fed it very simple prompts along the lines of:
/imagine a cartoon style army ant transparent background –no shadow no wings
This gave me a decent enough image to work with. For info the ‘–‘ in the prompt tells Midjourney what elements you don’t want to see.
The only different one was the cartoon image of me. For this I uploaded a real picture of me into midjourney, and asked it the following (subbing my image URL in the text below):
/imagine imageURL line drawing cartoon character, flat isolated background
It did take a bit of time to get the right prompt, as I got some pretty ‘interesting’ results before this:

I then put all of these images into Figma, reduced their size, and used a ‘remove background’ plugin that meant I got a transparent background (rather than a white square).
I added these to my Tableau shapes directory and set these as the shape on the viz.
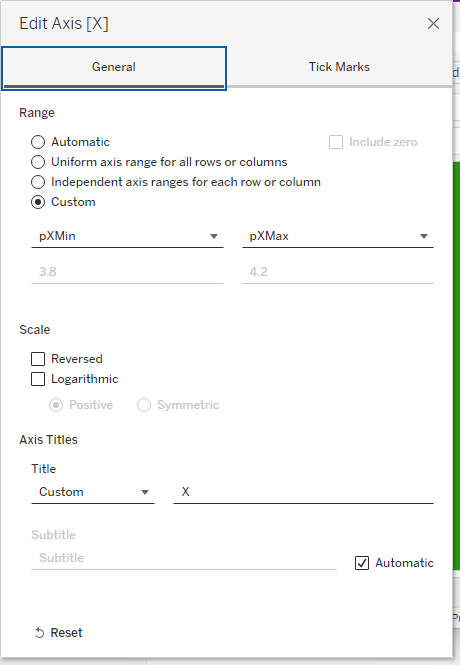
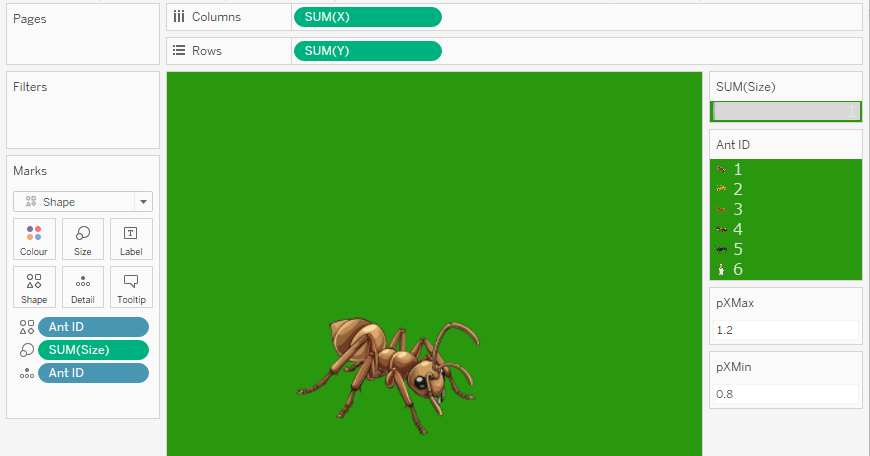
Big Ants
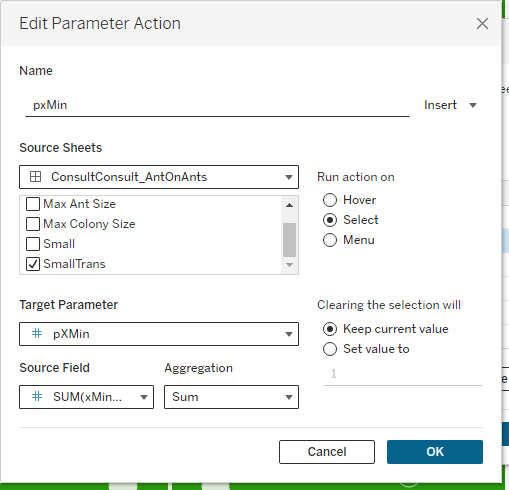
This worksheet was designed to only show the Big ant that has been chosen. For this one I used the X and Y coordinates from the data file, and then made use of Dynamic Axis Ranges to update what portion of the view you see at each change of the Ant ID parameter.
I made two parameters, pXMax and pXMin that would control this:
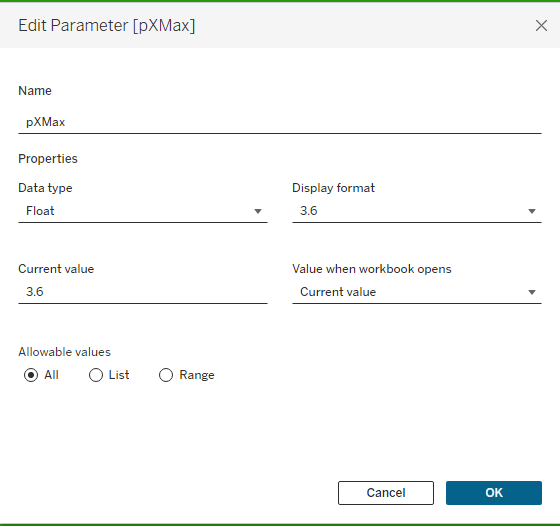
My default values for these were 3.4 for min and 3.6 for max which would show a blank space (room for the instruction layer) in the middle of the 6 ants. This is how they look assigned to the axis:
These parameters get updated from the final transparent layer, and give the effect of the big ant appearing into view. Also this worksheet has a background colour the same green as the background of the main dashboard – the reason for this is we want to hide what is going on underneath (i.e. hiding the small ants from view as they pass under the magnifying glass).
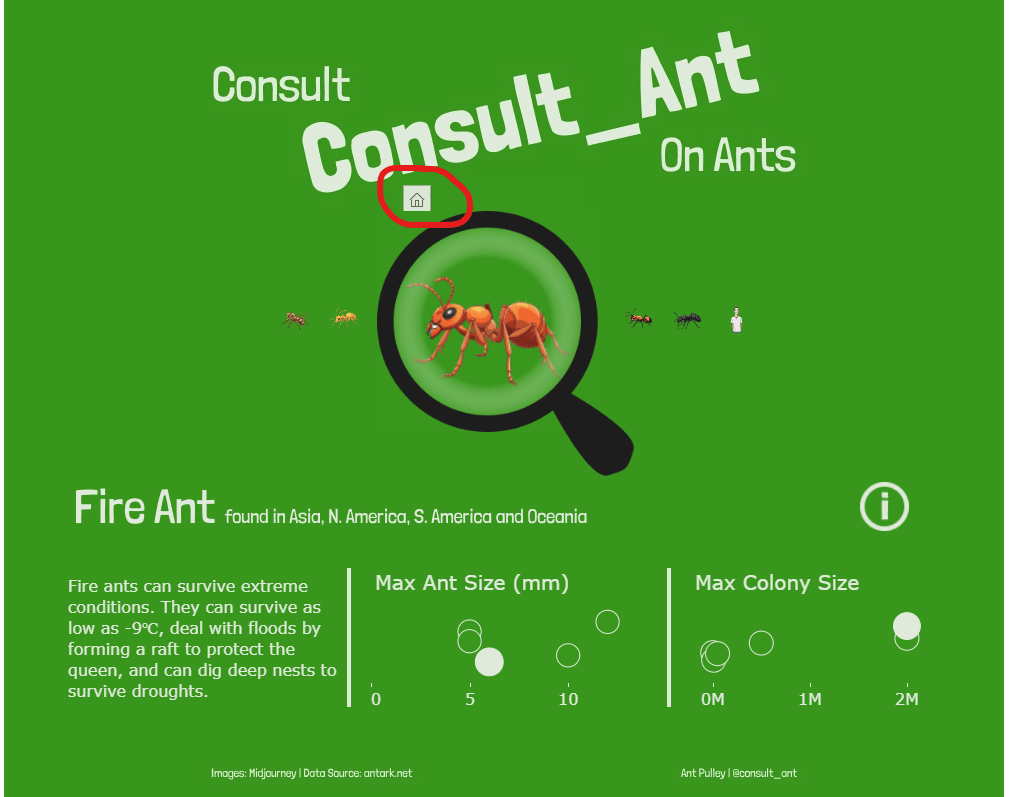
Blank Green Square
This was a bit of a funny one to cover a quirk of publishing in Tableau Public. Basically what seems to happen with Dynamic Axis Ranges, is that when you publish on public, and you update the axes from the default position, you get a little ‘home’ button appear in the top left of the worksheet. It doesn’t happen on desktop and I definitely didn’t want this to be visible, so for a quick way to hide it, I just positioned a green ‘Blank’ object over the offending area.
Find and Ant! Image
The next layer was my ‘Find an Ant!’ text. I built this as an image in Figma (so I can keep the consistent font from my dashboard title) and placed it as the next layer. I then used Dynamic Zone Vizzibility (DZV) to only show this when the Ant ID Parameter was 0, using this calculation:
ShowText
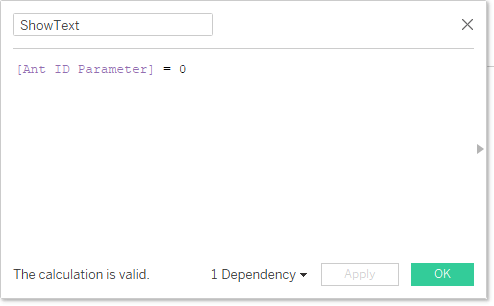
DZV only works with a parameter or a calculation that returns a Boolean (True or False). Also if you are using a calculation, it needs to be viz independent – which means it must not change value based on what fields are in the viz. So creating a calculation from a parameter works well for this.
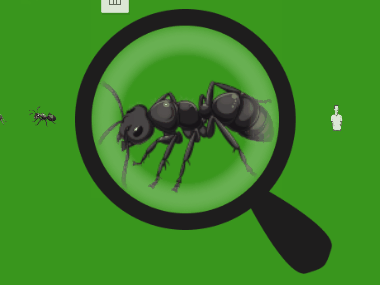
Magnifying Glass Image
The next layer was my magnifying glass image, which needed to be placed on top of the ‘Big’ ants sheet to appear like you are looking through it. I built this icon in Figma and it looks like this:

It was built very simply with circles and rectangles, but there are a few things to notice. One is the blurred inner ring which is designed to give it more of a magnifying glass appearance. Another is the inner ‘white’ area, which is actually transparent so you can see through it in the viz. And finally there is a green box around the outside of the magnifying glass.
This green box is the most important thing as it serves the purpose of hiding any parts of the ‘Big’ ant images that are animating underneath it. This is a result of having a circular magnifying glass with a square worksheet under it. Without this, you would see (particularly for the cartoon of me) parts of the image appearing outside of the magnifying glass, which ruins the aesthetic!
Transparent ‘Small Ants’ worksheet
And finally, we have the ‘Control’ worksheet, which is a transparent layer containing all the calculations required to drive the animations. This needs to be transparent and on top due to all the layering required to get the effect underneath.
The sheet itself is an exact replica of the ‘Small Ants’ sheet, but using a transparent shape instead and also including a few extra calcs used to drive the parameter changes:
xMaxUpdate

xMinUpdate
These two fields will update the parameters for the Dynamic Axis in the ‘Big’ ants worksheet, and the ‘AntID’ field will be used to update the main parameter which drives the ‘Small’ ants sheet and other DZV elements.
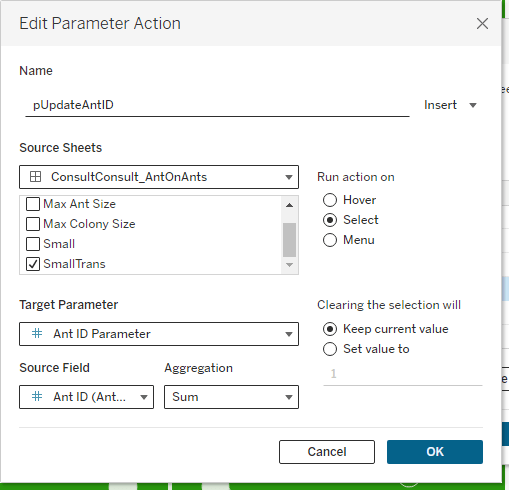
On the dashboard page there are three parameter actions that control this. The xMin and xMax look like this:
And the AntID one:
If you are looking at my workbook you will also notice I am using the ‘True’/’False’ filtering trick to deselect the marks as the user selects them. In this case I didn’t need to do it, as I am hiding the ‘Selected’ small ant under other layers, so this is actually redundant (just habit!!).
And this is how the top part of the viz was done! Lots of layering, hiding and trickery to try and get the desired effect – but I am happy!
You will be pleased to hear the bottom half was much simpler…..
The Viz – Bottom Half
This section was much simpler, so I won’t go into too much detail. But the crux of it is this:
6 Images which have the ant name and location, all built in figma and switched in and out using DZV. As an example, here is one of the calculations for this:

6 Text boxes that have the description in, also all controlled by DZV as above,
Two white background Blank objects to separate out the elements.
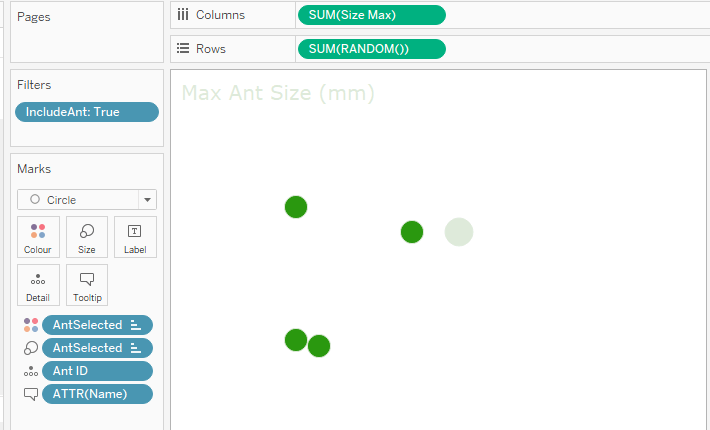
Two dot plots showing the Max Ant Size and Max Colony size. For the Max Ant size chart, as I am significantly bigger than a normal Ant, I actually filtered my value out for all ant selections apart from my own as otherwise you can’t see anything. Here is the calculation I used as a filter:
I also used the RANDOM() function to create a jittered effect for the dots, rather than just having them in one line and getting more in the way of each other:
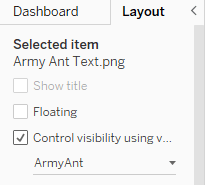
One show/hide container button which shows up the information on the midjourney images.
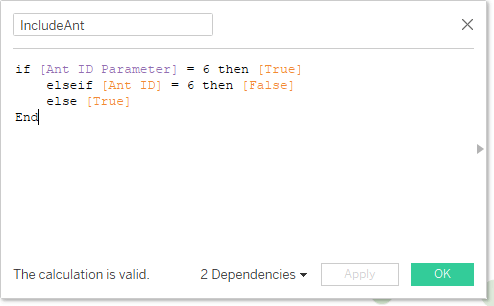
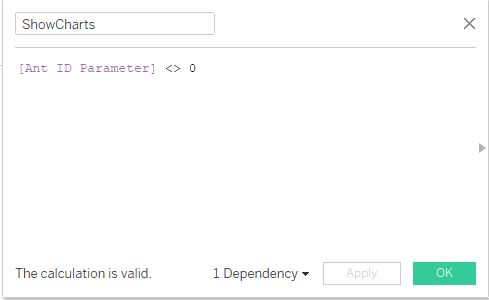
One overall container for this section which is controlled by DZV again, and will hide everything when the Ant ID Parameter is set to 0 (i.e. the start state of the viz). This works with the ‘opposite’ calculation to the ShowText one from earlier:
ShowCharts
And that is pretty much done!
A note on Animations
I thought it worth having a brief note on animations as they can be a bit of a black box in Tableau in terms of when they will stop working, particularly when using custom shapes and images. I found very quickly that if my images were too large, then the animations stopped working, so I used figma to adjust sizes until I got to one that worked well.
Interestingly, Tableau Desktop on my Laptop seemed to give up on animations before Tableau Public did – so I had to do a lot of the work by testing on Tableau Public as the animations were running much smoother there. In hindsight, once I noticed this I should have just switched to web edit and carried on there! Lesson learned!
Finish
And there we are! I hope you found that interesting, and maybe even useful! Feel free to download the workbook and have a play, or drop me a message if you have any questions!
Thanks,
Ant.
