I recently posted a somewhat silly viz based on the game Elden Ring, and my main aim in creating it was to try out creating an animated ‘Carousel’ type menu:
This menu has elements that scroll as you select them, and will infinitely scroll through the members (in this case there are six items for each piece of armour).
I wanted to walk through how I did this, as I think it can have some fun and interactive applications.
The Theory
So in order to do this, we need to understand a bit about animations, and when they animate and when they don’t, as well as how we can use that to make the above work.
Firstly it is very easy to make things move from left to right, or right to left from a parameter, you can just have a coordinates measure that updates when you change the parameter. This is the basic part of what we are doing:
Next, it is also pretty easy to fix the Axes at a point meaning you will only see one element at a time which will animate off the screen when you change the parameter.

In order to get an ‘infinite’ scrolling effect, this is a little bit trickier, as you need to get the marks from the left (or right) side back over to the opposite side without seeing it visually – as by default they would fly back past on the screen like this (You will have noticed this in the previous gifs):
The way I chose to get around this was by utilizing the fact we have fixed the axes and can only see one element at a time. What is important here, is that once the marks are off the visible screen, it doesn’t matter anymore if they animate. So what we can do is move the mark off the screen via animation on one click, and then ‘null’ out or remove that mark on the next click – this causes it to disappear from the non-visible part of the view. Then we can bring this mark back in on the other side of the view the next click along. See the below gif which is the same data, but the Yellow mark is no longer travelling across the screen as it has been ‘Nulled’ out when off the screen.
It is worth noting that you need a minimum of 4 marks to be able to do this (if you are only allowing one to be visible at a time). If you only had 3 marks, you could then just double the number to 6 and duplicate them in order to get this to work.
The Build
So now we have in theory what we need to do, here are the steps to get it working in Tableau, using the simple example I worked through above.
For this example, I will use a small data set containing just 6 items:
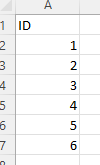
These will represent the 6 marks I will be scrolling through.
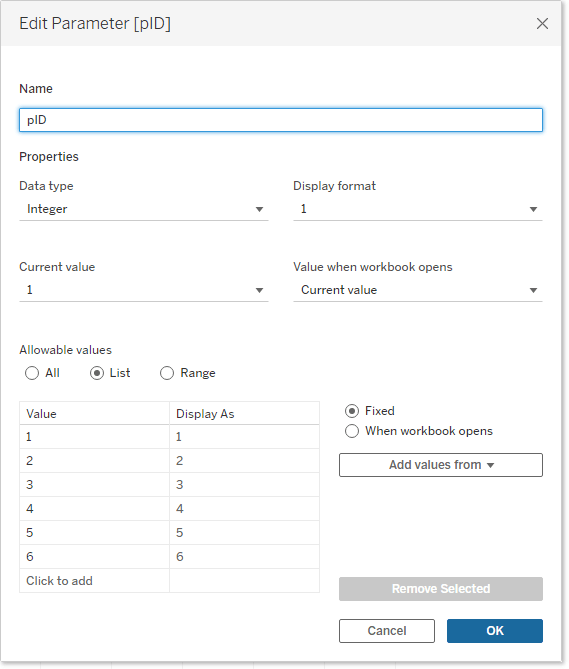
To start with I need a parameter pID, which I can use to flag the ID central to the view:
I then need to create some co-ordinates calculations so I can plot these marks based on the parameter. Please note that this assumes we will move through the ID values sequentially – and not jump several values at once.
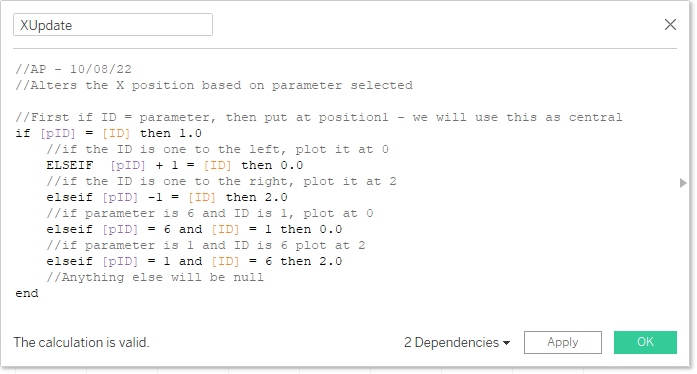
XUpdate is our main driving calculation, it will put the ID equal to the pID at the central position of 1.0, and arrange one to the left and one to the right (at 0.0 and 2.0). It also works out if you are at point 1 or point 6 so you can place these correctly. Finally, anything else will get nulled out and essentially be removed from the view. Note I have used decimal values as this will give me more control of fixing axes later.
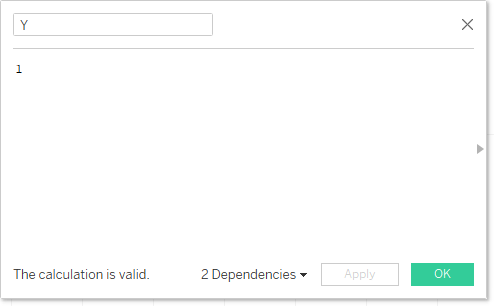
Y will just be set to 1, as we won’t be changing this value.
Place them on the view as per below, and then you can see how the animation is actually working before fixing axes:

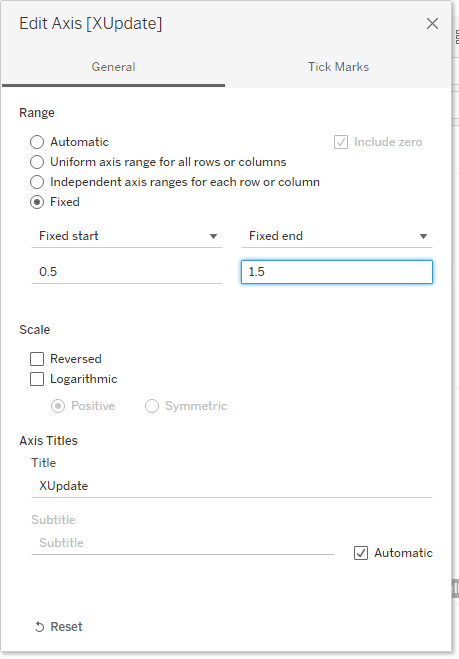
You can see each time I change the parameter, the mark to the right disappears out and the one on the left appears in, while the other two animate over. Once we fix the axis, this will then mean we get a smooth appearance. We fix the X axis at 0.5 and 1.5:
And now changing the parameter gives you this:
Exactly what I am after! This is all the hard work done, now there are a few bits to sort before the user experience is sorted.
We want to provide left and right buttons rather than a drop-down parameter list – this way there is no chance of accidentally skipping any marks and messing the animation up.
This can be done simply using two other worksheets (or one depending on where you put your arrows) and two calculations:
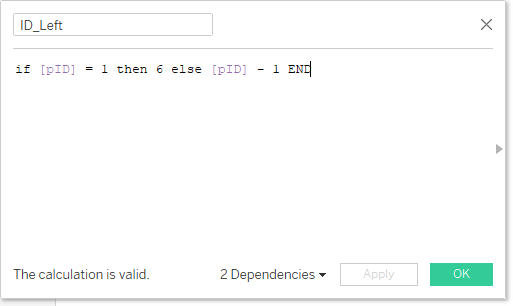
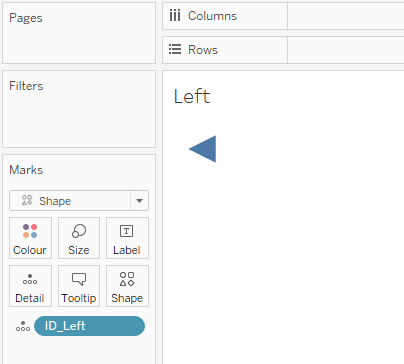
This will allow us to change the parameter using a parameter action when you press a left arrow. It basically takes the current parameter value and reduces it by 1, or sets it to 6 if we are on 1 already. You can add this to a separate worksheet like this, using an arrow shape:
Then add this to your dashboard, along with the following parameter action:
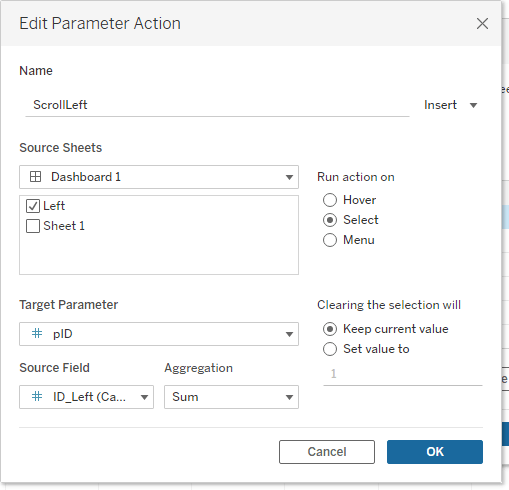
This will achieve the following:
And you can rinse and repeat for the right arrow with a slightly different calculation:
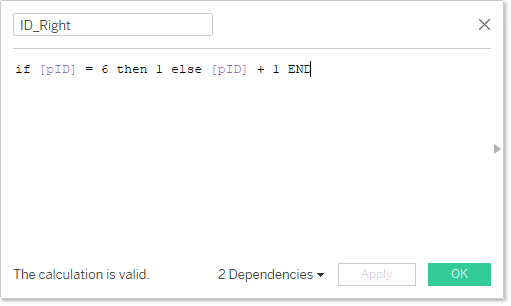
Add it to the dashboard with another parameter action, and we have it working!
One more thing is to use the TRUE/FALSE filter trick to deselect the arrows as soon as they are pressed, to improve the user experience. Then tidy up the formatting and we are done!
I hope you found this interesting! I have posted the workbook to Tableau Public if you want to have a look yourself:
Animated Continuous Carousel Example
Thanks!
Ant.

One thought on “Create a Carousel menu in Tableau”