Hi All – my rather pointless but fun Mr. Tickle viz seemed to go down well in the community, so I thought it would be good to do a quick (edit: ended up not being that quick – sorry!) blog on how it was built in case anyone wanted to create it (or other bendy limbed characters)!
Overall Structure
The overall structure of the dashboard is pretty simple:
- Background Image with Title
- Worksheet with two map layers for the arms
- Image of Mr Tickle’s body
- Worksheet for the buttons
The whole animation is then powered by one Parameter.
Data Prep
In order to build the viz I needed the data to be the coordinates of the line that makes up his arms. To do this I used a combination of Figma (to draw the line) and the automeris tool (https://apps.automeris.io/wpd/ – original blog I use from CJ: How to ace shape making) to make coordinates out of it.
The Figma line was simple – I used the ‘Pen’ tool to draw it, but could just as easily use the pencil or other tools. The main thing was I didn’t want it too ‘Smooth’ as I wanted it to keep a bit of a hand-drawn cartoon look like the books:

I loaded this into the automeris tool as an image, set the foreground to black and hit ‘Run’ on the default settings to see what points I get:
This is good – but I probably want a few less points as this may also end up too smooth otherwise, so I tried upping the x and y parameters to 20 each:

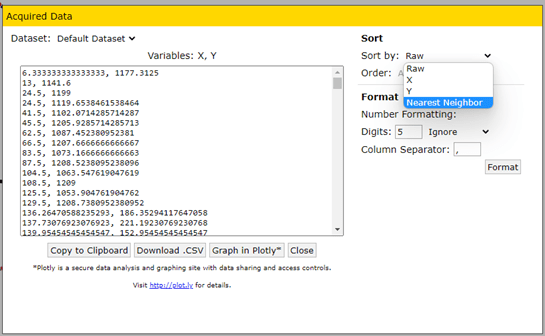
This looks better – so I used this. Now I can choose ‘View Data’ to see the coordinates. I found the best ordering to use for this was ‘Nearest Neighbour’ prior to downloading the csv – I need to have the points ordered for the viz and although this doesn’t quite fully work, it is the closest I found.
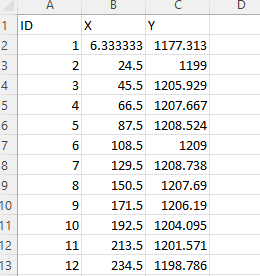
Now – exporting this to csv I then added an ID field to the side going from 1 to 220 so I can tell my viz how to plot the line:
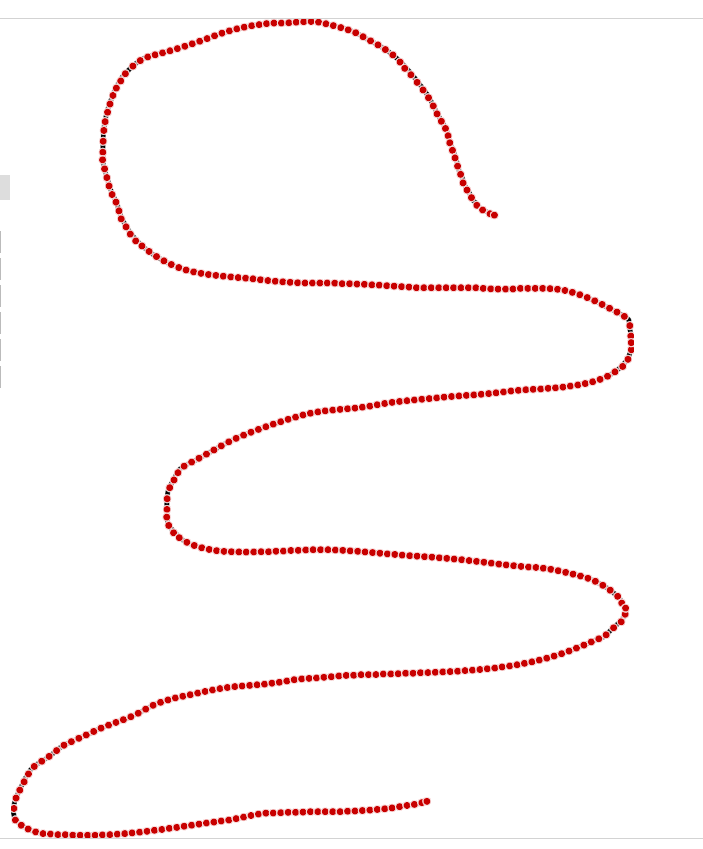
Now I can import this into Tableau and check if it looks ok (Note I had to reverse the Y axis).
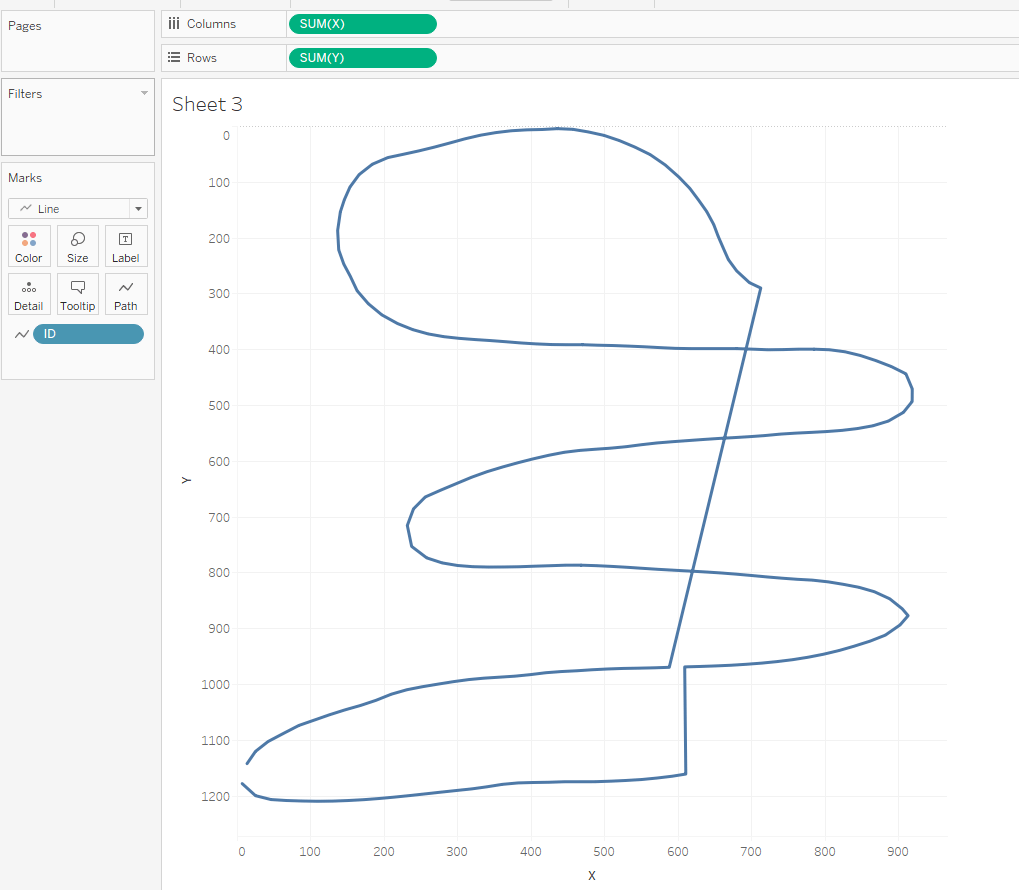
Putting the X and Y coordinates on the page and ID on the path shelf (I need the IDs in order on the line) I can see this doesn’t quite work – this is due to the automeris tool not giving me the coordinates in the right order. By selecting ‘nearest neighbour’ earlier I could get most of it in the right place. From this I was able to re-jig the data order so that it ended up correct:
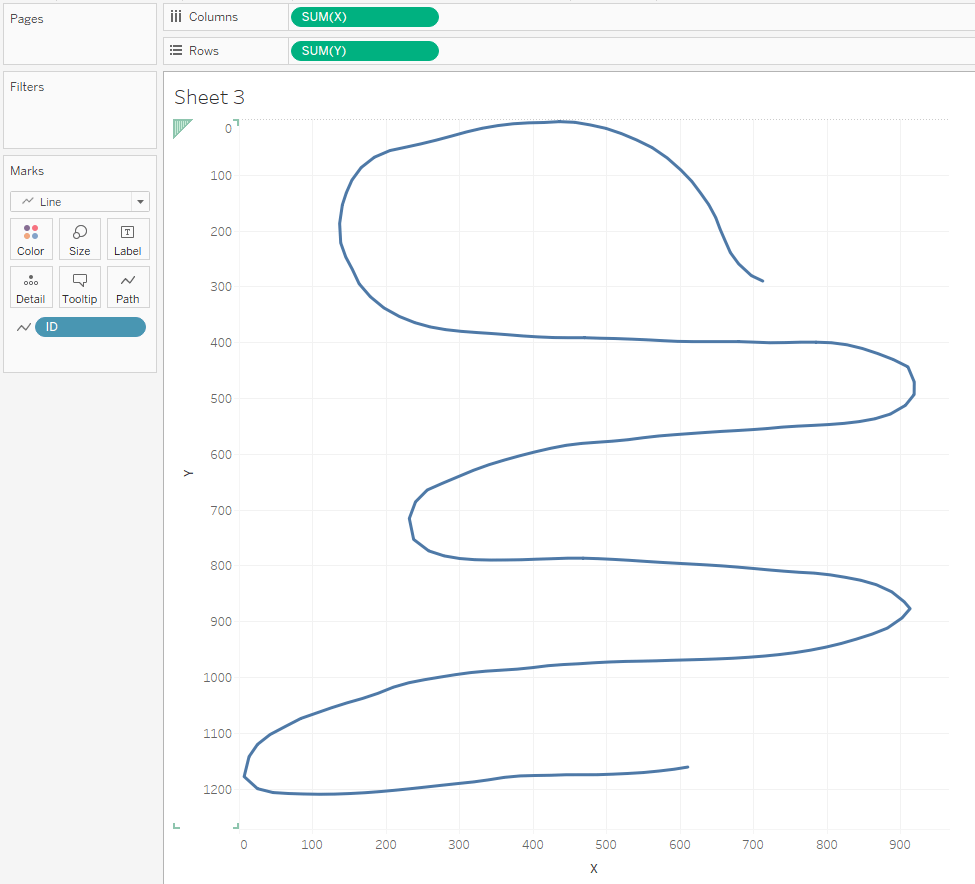
That’s better.
Now the final bit of prep for the data is to also add in data points for the ‘Fingers’ – which are also just lines on the page.
For this I need to add two data points for each finger – but also add in a ‘Type’ column so I can distinguish between fingers and arms:
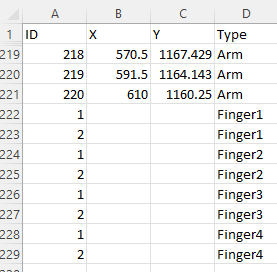
I don’t need X and Y values for the fingers as I will calculate them later.
That is the data done!
Arm Viz – Calculations and Parameters
Now I will build the calculations and parameters I need to get this all working before I move on to getting the Arm viz working.
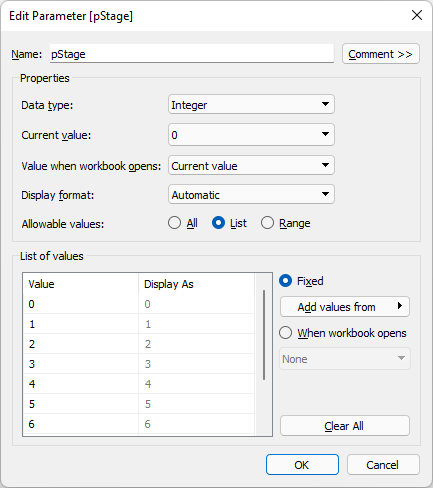
pStage parameter
This parameter drives the viz and is just an integer from 0 to 8 (although I only ended up using 0-5).
I also have a bunch of ‘Finger’ parameters – 16 in total, for the X and Y coordinate offsets for each finger and hand position (I used two in the viz). I was a little lazy here as I probably could have made this a bit more dynamic, or potentially used shapes instead. But this did mean I could finely tune how the fingers looked!
Stage Check
This calculation allows me to choose which points I want ‘plotted’ at each stage:
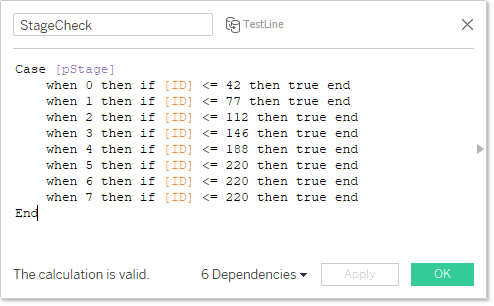
I basically chose the ID that sat at the point I wanted the animation to move to next. Stage 0 in this viz is the initial arm position – stage 5 is the finishing position (I didn’t end up using anything above).
XUpdate/YUpdate
These two calculations drive the coordinates for the arms and fingers:
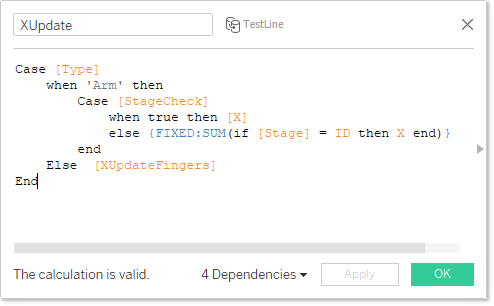
It first checks the ‘Type’ – if it is ‘Arm’ then it will check what stage we are at first. If the ID is within the ‘Stage’ then it just pulls back the X value from the data. If it isn’t in the stage (it is a point further down the arm) – then it will take X value of the current stage ID using a Fixed formula. This essentially means all future stage points are stacked on top of the latest stage point. This is a very important step for this animation as it means the arm is essestiolly telescopic as all the points originate from the last static point.
If the ‘Type’ is ‘Finger’ then it brings in the following calculation instead
XUpdateFingers/YUpdateFingers
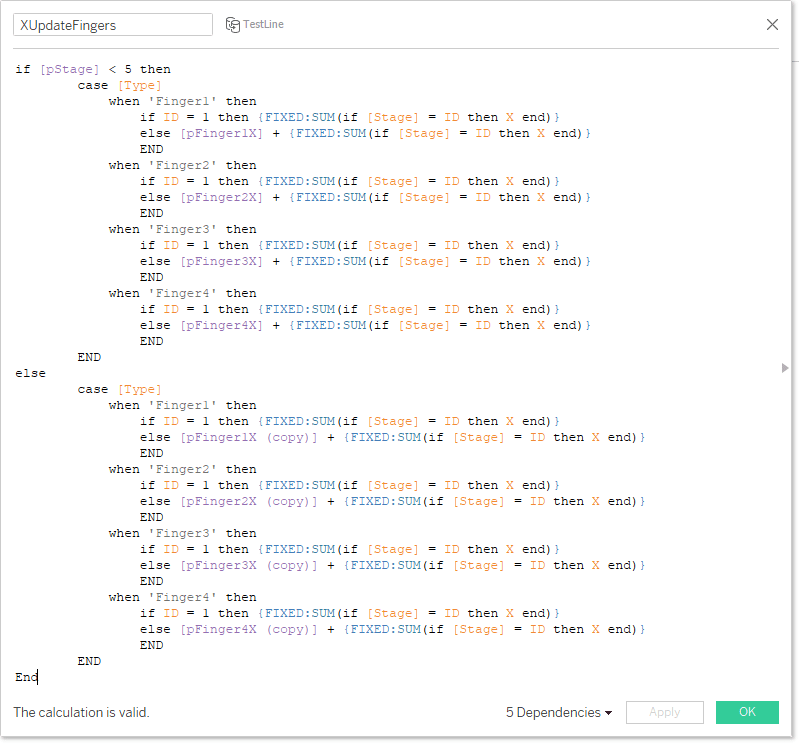
A bit of a beast! But essentially very repetitive.
The outer if Statement looks to see if the stage is less than 5 (as I use one hand position for the first 4 stages) or not.
Within these, it looks for each finger type and adds an X (or Y) amount to the latest stage point in order to make the fingers appear from the end of the arm.
If the ID is 1, this is the part of the finger that starts from the arm, so the coordinate should be the same. If the ID is 2, then we want to add on the parameter values so the second protrudes from the arm. Then we can visually change how the hands look using the parameters.
LinePoints
As I am using Map Layers for this viz, I need to convert my coordinates accordingly (check out Luke Stanke blog https://www.tessellationtech.io/beyond-dual-axis/ for more info on this)
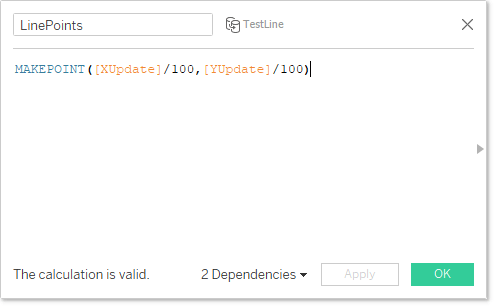
I am dividing by 100 here to make sure my values sit between -100 and 100.
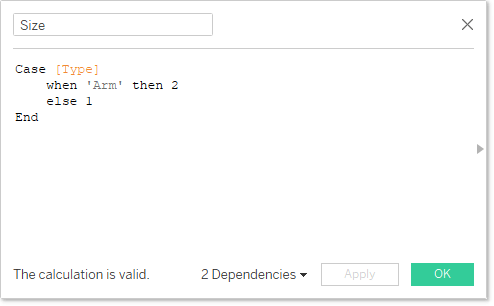
Size
I will use this to size the thickness of the Arm and fingers:
So these are the calculations required to build the main arm and hands, so let’s build it!
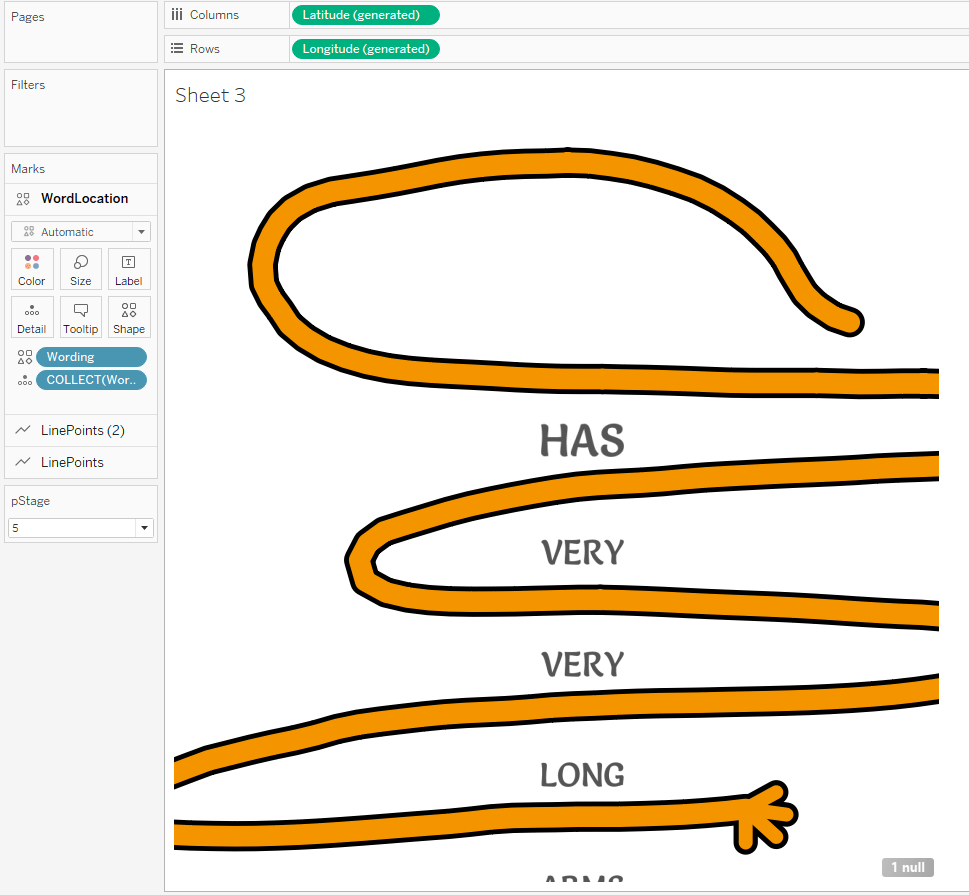
Arm Viz
First make sure your pStage parameter is set to 5 so you can see the whole thing.
Firstly drag ‘LinePoints’ onto the canvas – this should put some dots on a map. Then drag ‘LinePoints’ on again – this time adding to the map layer and giving you two marks cards (you need to do this before the next step, otherwise your ‘Map layers’ will disappear.
Then you want to hit ‘Swap Rows and Columns’ (ctrl+w), change the mark type to ‘Line’, add ‘Type’ to detail, and add ‘ID’ to the path shelf to get you:
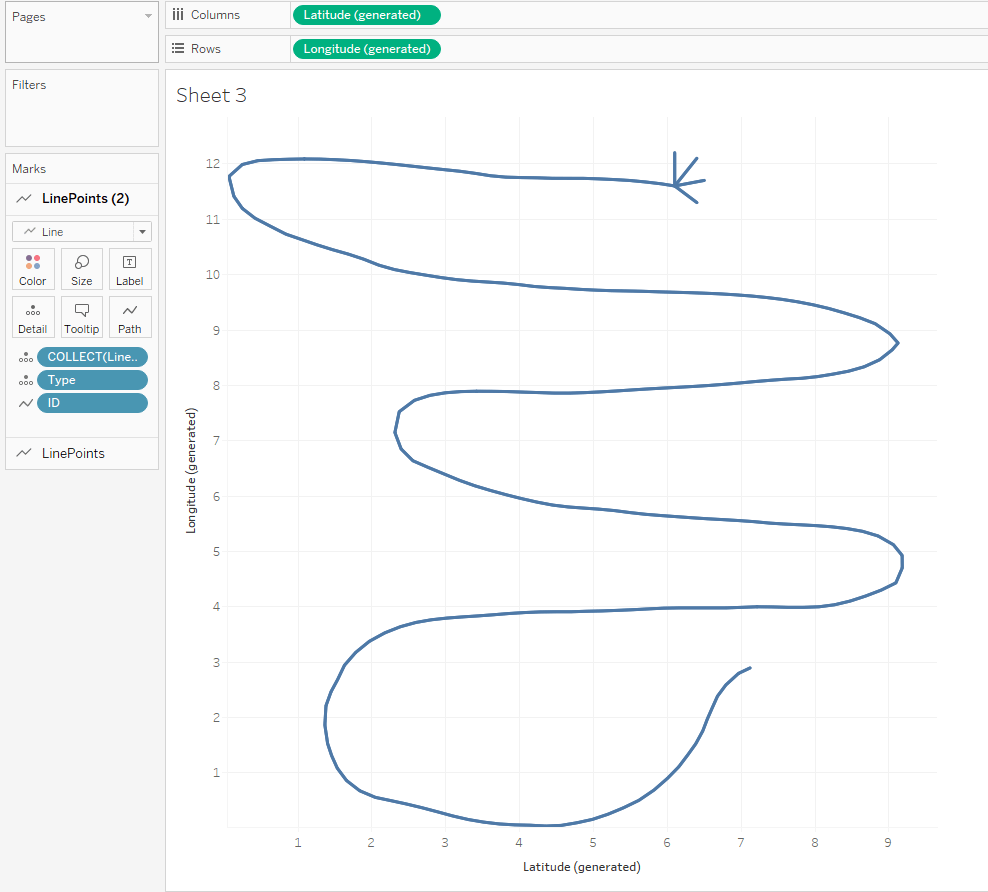
Which looks roughly like an arm! However the Y axis is the wrong way round for us, so just Edit the axis and hit ‘Reversed’:
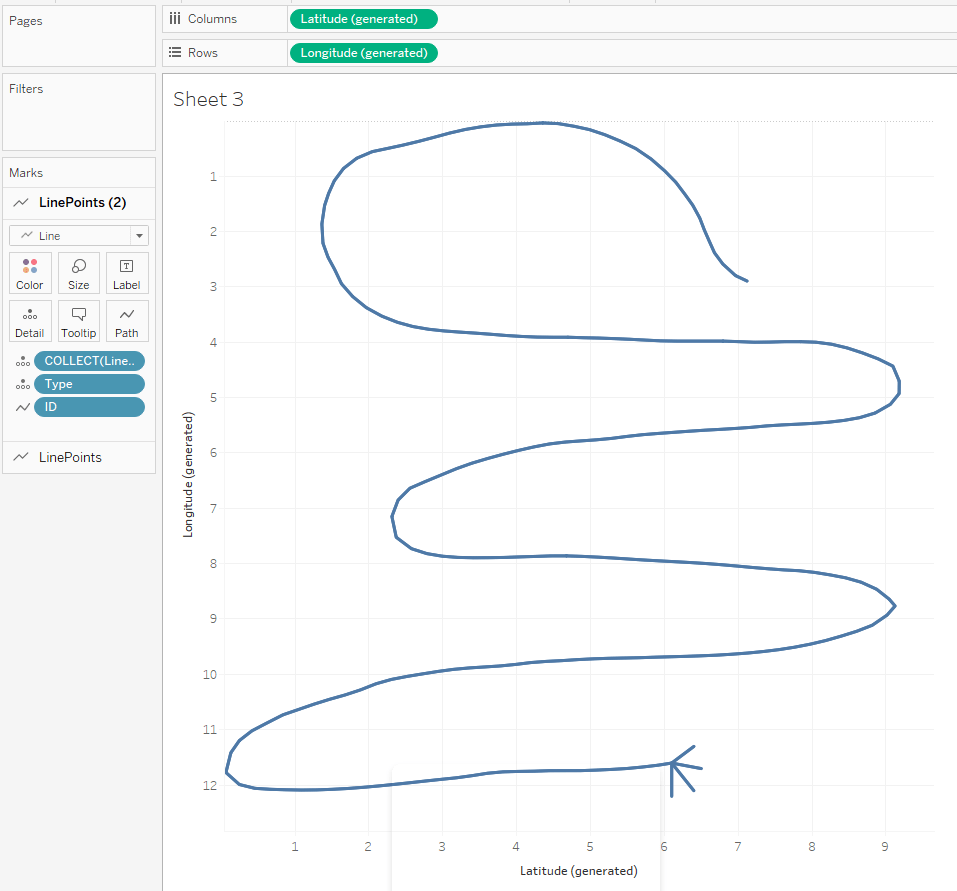
Do the above steps for both line marks.
Now if you change the pStage parameter at this point you will see that the animations start to work – although the axes are resizing along with this which we don’t want:

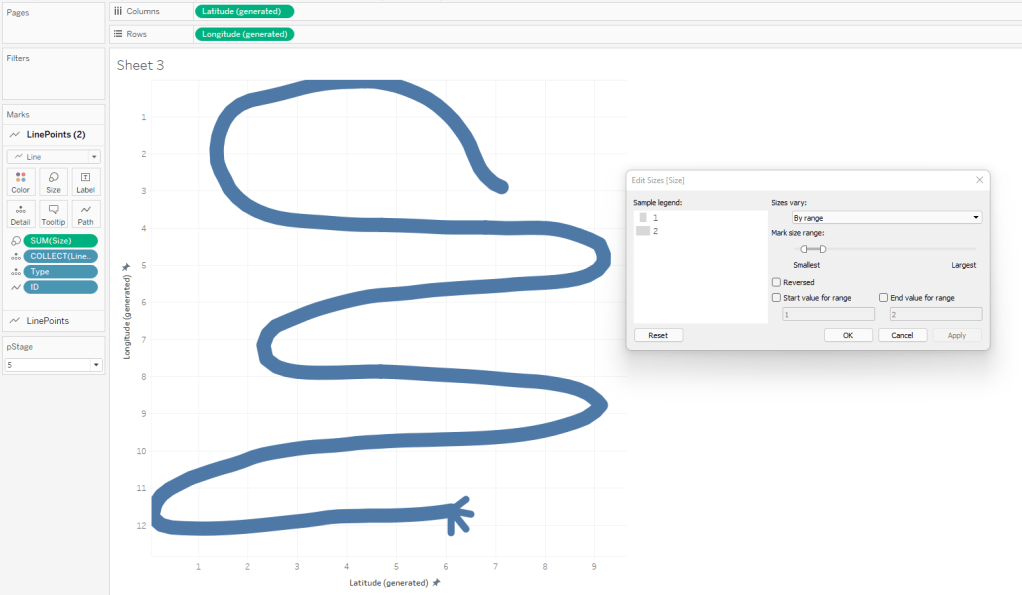
So for now, just Edit each axis and fix the Max and Min values (when you have your pStage set to 5) to make sure the canvas stays the same size.
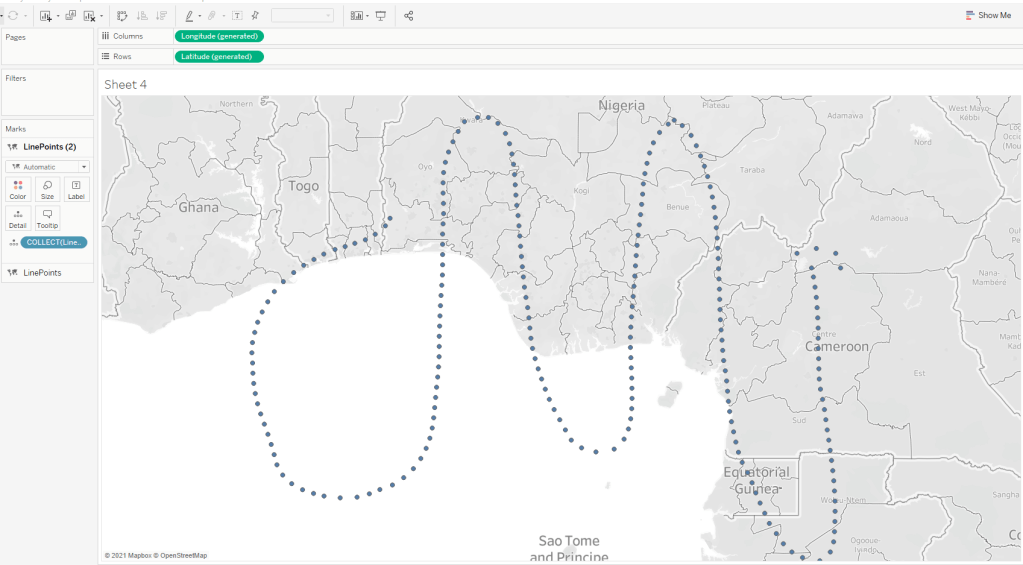
I can then add ‘Size’ to the size shelf in order to make my Arm slightly thicker than the fingers. I like to have a bit more control above the default size slider by using the edit size menu to specify how small and large I want them to be (hint use the ‘Apply’ button rather than ok, as it will show you the changes without leaving the dialog box in case you need to change again)
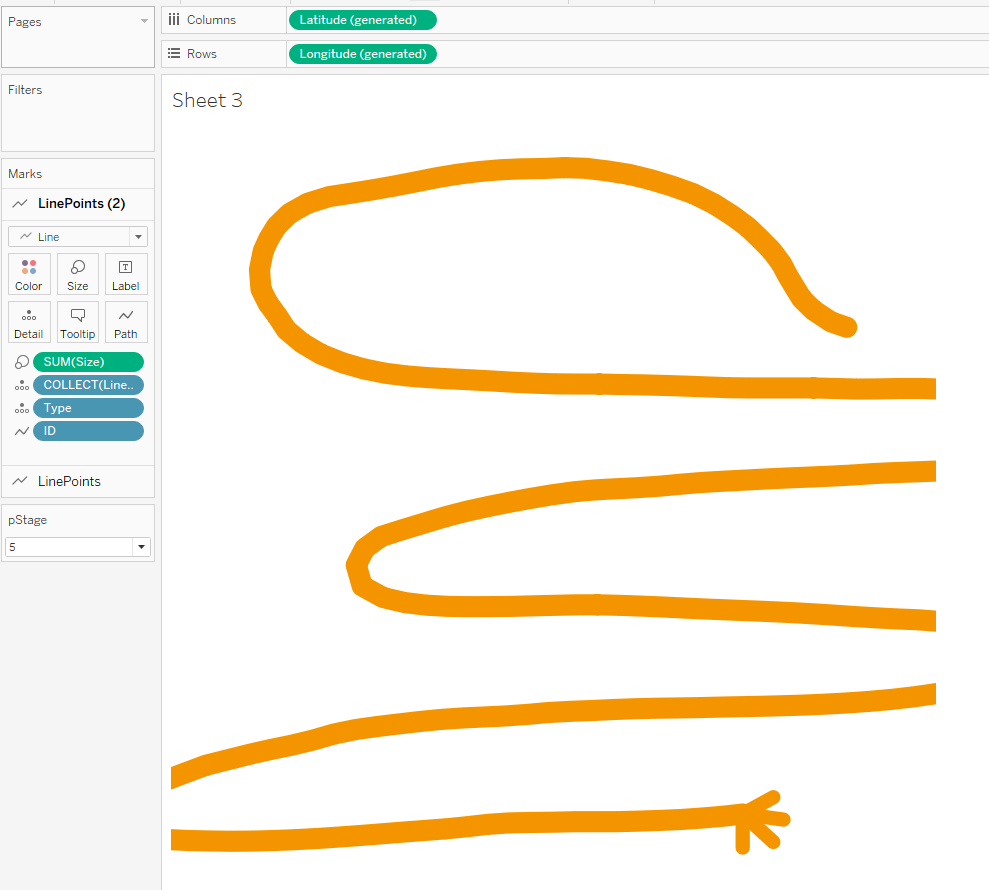
Next I will make my arm ‘Mr. Tickle’ orange, and as I want my arm to come in and out of the page (which also makes it a little easier when sorting hand positions as there are less to do!) I can tighten the fixed axes a bit so some of the arm is not visible. Also I remove headers and remove background formatting:
Pleased with this! But the original Mr. Tickle illustrations are quite distinct, with quite a thick black border:

And I had an idea that I could do this with just having a thicker black line underneath the orange line so that it appears to be an outline. Hence the reason for the second layer we added earlier. So I can repeat everything I have done with the orange arm layer and apply to the black arm layer, and just tweak the sizes to be a little bigger.
I was very happy with how this turned out, plus it looks Ace when animated!

NOTE – one thing I realised doing this was that I needed to DUPLICATE the ‘Size’ field as if I used the same one then any size changes applied to all layers on the worksheet. So duplicating it meant I could independently size the second arm.
NOTE 2 – I haven’t spoken about altering the hands yet – that is because it is best done at the final Dashboard stage in case any sizing choices on the dashboard impact how the hands look.
The Words
The arm viz is pretty much done, I just had one more layer to add – the words. The ‘Mr Tickle’ title is already part of the background image, but the other words need to appear as the stage changes.
I created the words in Figma with the same format as the title and exported them as separate PNG files to add to my Tableau repository Shapes folder.
Then I need a few fields:
Wording
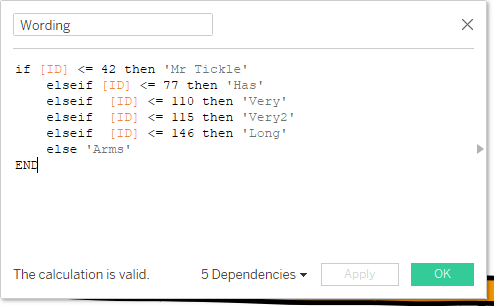
This just assigns a work to a particular range of IDs in line with the stages.
YWords

This assigns a Y coordinate for each of the wordings – positioned between the arm.
WordLocation
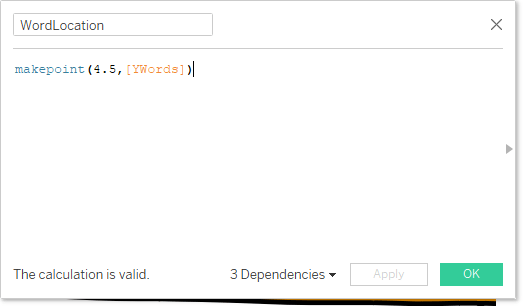
This makes the point out of an x value of 4.5 (this won’t change between words as it is central) and the Y coordinate assigned in the previous calc.
Put in the Viz
Now you can drag ‘WordLocation’ into the viz as another Map Layer, and add ‘Wording’ to the shape shelf. Then the word shapes can be assigned to each word and you will get the below (may need to increase size):
Note you will need to re-fix the Y axis to fit the last word in.
Handily, due to the way the ‘Wording’ calculation is built – it will return null if the word does not appear at that stage, which means it will stay blank as we want!
This is the ‘Arm’ viz complete (and the bulk of the work done!)
Button Worksheet
Next I just want some buttons that allow the user to move through the ‘Story’ (in the loosest term!). I had originally intended that these be on the same worksheet but I couldn’t get the experience right in terms of animations and deselection of buttons, so I ended up floating this one above.
A much simpler sheet – I just need three more calculations:
YButton
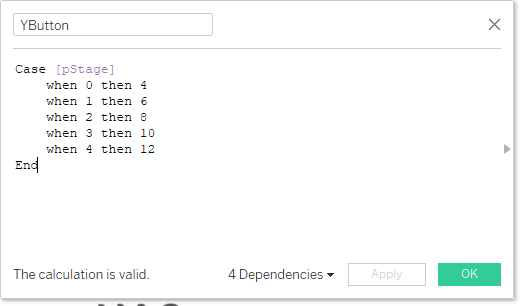
Much like ‘YWording’ but just set slightly lower on the Y axis.
ButtonLocation
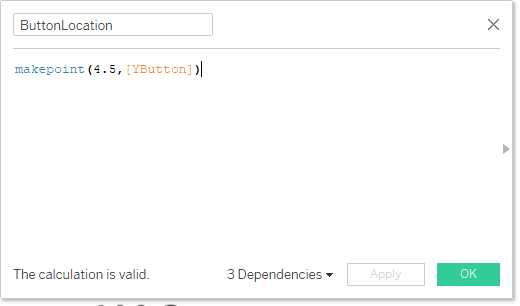
Again pretty much as per wording.
pStage+1
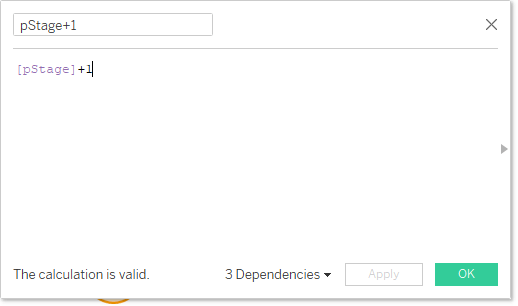
This will be passed to the parameter to move the story along – just adding one to the current parameter value.
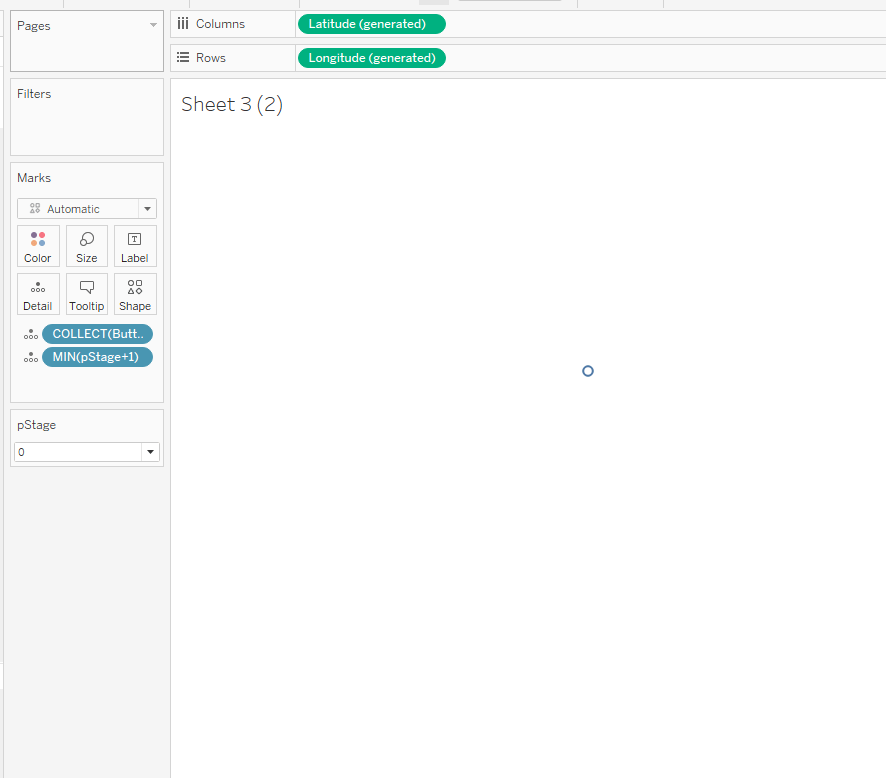
Sheet Build
I found the easiest way to start this was to copy the arm sheet (as that is all set up with the correct dimensions) and hide the layers, then drag ‘ButtonLocation’ into another layer. You can delete all the other layers once done. You should also drag ‘pStage+1’ onto Detail (Minimum):
Now I can change the shape to be an Icon I created in Figma – and this will sit over the arm dashboard and control the parameter.
Build out the Dashboard
Next is to put on a dashboard. I chose to make my dashboard 800px wide and 1200px long. You would then put the elements on the dashboard in the following order, all floating:
- Background image filling the whole screen
- ‘Arms’ sheet filling the whole screen (make sure the background of the worksheet is set to ‘None’)
- Mr Tickle body image (I made mine in Figma) – place over the end of the arm
- ‘Buttons’ sheet filling the whole screen (make sure the background of the worksheet is set to ‘None’)
This is the format, now just for a couple of dashboard actions. First the parameter action to progress the Viz:
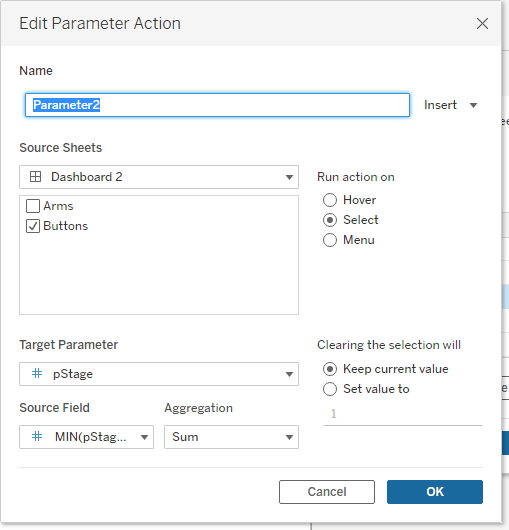
This will increase the value of pStage by 1 on clicking the button, meaning the animation will progress:
2 things to note here
- The buttons are animating – meaning you can see the button fading out when clicked. I want a clean view so choose to turn the animations off for this specific worksheet.
- The button isn’t ‘Deselecting’ once it has been pressed so I need to fix this.
To fix the deselecting issue I use the tried and trusted ‘True/False’ filter technique, involving creating two calculated fields called ‘True’ and ‘False’ which contain the values True and False. You add ‘True’ to the detail of the buttons sheet and add this filter action to the dashboard:
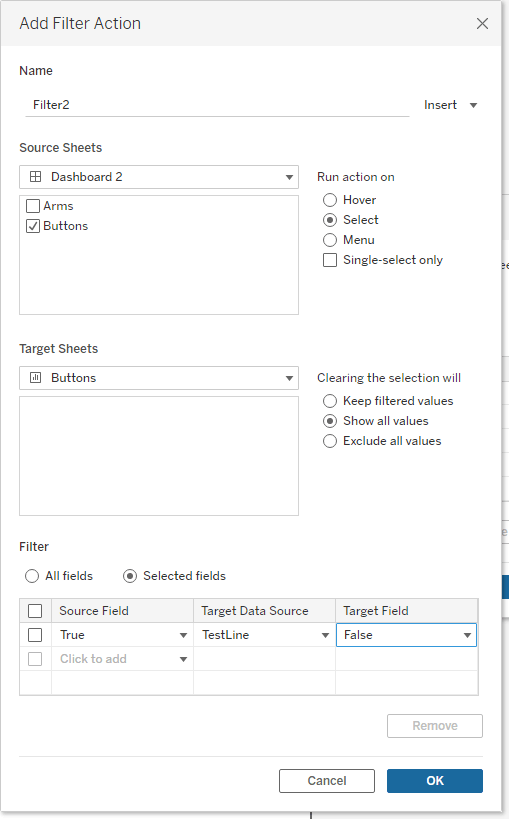
This filter action will deselect the mark, ready for selection again! Now we are nearly finished… The final thing to do is to adjust the fingers if required – that can be done using the Finger parameters I set up earlier, so fine-tune how they look:
And with that final bit sorted – we are finished!

I hope this was enjoyable and you picked up a few things – also always interested if I could have done anything differently/more efficiently!
The link to the final viz is here: Mr. Tickle Viz
Thanks, and happy Tickling!
Ant.
