Skip to content

Learnings on Data Visualisation and Tableau

  • Linked In
  • Twitter
  • Tableau Public

Ant Pulley | Blog

  • Home
  • About
  • Portfolio
  • Sketches vs Reality
  • Contact

Tag: map layers

Building an Interactive Skyrim Map

March 4, 2022March 4, 2022 by consult-ant, posted in How To, Tips

Walkthrough of how I built my interactive Skyrim Map in Tableau.

Tagged #blog, #Figma, #parameter actions, #tableau, map layers, Parameter Action, Tableau1 Comment

Decorate Your Own Tree – A Walkthrough

December 14, 2021 by consult-ant, posted in General, How To, Tips

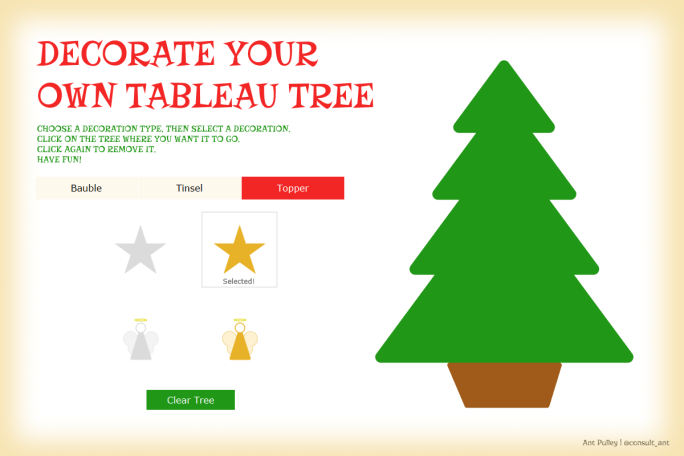
A walkthrough of my 'Decorate your own Tree' viz on Tableau Public

Tagged #blog, #parameter actions, #tableau, map layers, Parameter Action, TableauLeave a comment

Mr. Tickle!

November 18, 2021November 18, 2021 by consult-ant, posted in How To

Hi All - my rather pointless but fun Mr. Tickle viz seemed to go down well in the community, so I thought it would be good to do a quick (edit: ended up not being that quick - sorry!) blog on how it was built in case anyone wanted to create it (or other bendy … Continue reading Mr. Tickle!

Tagged #animation, #parameter actions, #tableau, map layersLeave a comment

Tips and Tricks from my Twitter Viz

August 19, 2021 by consult-ant, posted in Tips

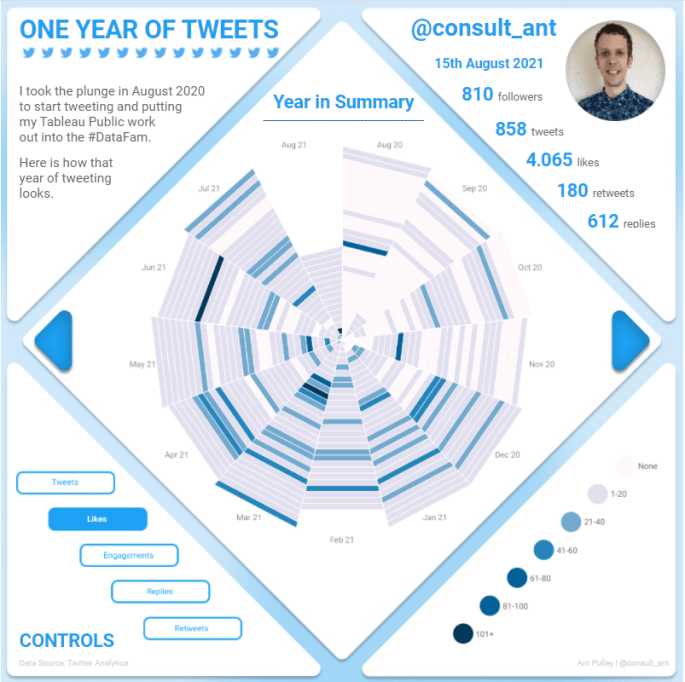
Some tips and tricks learned along the way building my 'One Year of Tweets' dashboard.

Tagged #Figma, #parameter actions, #tableau, map layers, Parameter Action, Tableau1 Comment

Makeover Monday 2021 – Week 18 – Map Layers, Polygons, Pages

May 4, 2021May 4, 2021 by consult-ant, posted in How To, Makeover Monday

Using Map Layers, Polygons and Pages to show an animated view over time of CEO vs Average Worker Compensation

Tagged #polygons, MakeoverMonday, map layers, TableauLeave a comment

Makeover Monday 2021 – Week 2 – Map Layers Learnings

January 12, 2021 by consult-ant, posted in Makeover Monday

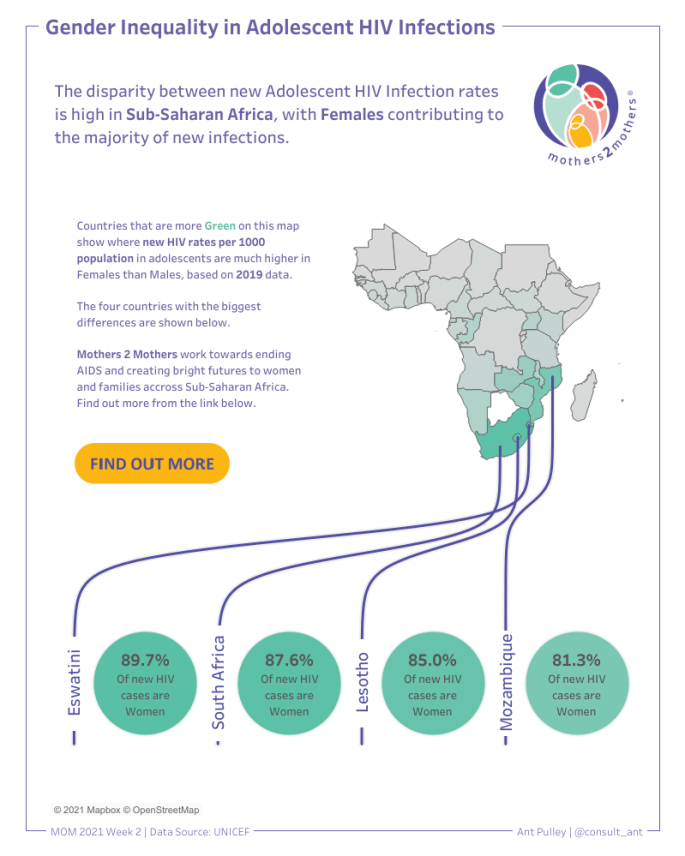
How I went about creating curved lines and using Map Layers for Makeover Monday 2021 week 2 - including some bumps along the way!

Tagged MakeoverMonday, map layers, sigmoid curves, TableauLeave a comment
Website Built with WordPress.com.
  • Follow Following
    • Ant Pulley | Blog
    • Already have a WordPress.com account? Log in now.
    • Ant Pulley | Blog
    • Customize
    • Follow Following
    • Sign up
    • Log in
    • Report this content
    • View site in Reader
    • Manage subscriptions
    • Collapse this bar
 

Loading Comments...